


2.2.2.4 The effect of elastic deformations during experiment
Materials destruction during scanning.
Once the contact pressure is estimated according to formula (4) in chapter 2.2.2.2, it is easy to determine which material can be damaged during scanning. For that it is enough to compare materials ultimate strength (measured in Pa) and arising stress (pressure
 ). See Appendix 1.
However, even if this strength is exceeded, no probe or sample material destruction can occur during scanning. The point is that the overcritical pressure should act longer than the damage process duration (relaxation time of elastic deformations is about
 s). During rather fast scanning of large areas this condition may fail. See Appendix 2.
Reconstruction of the surface feature shape from the scan line profile.
The change in the probe vertical position during scanning in the contact mode produces profile which can differ much from the real surface topography. One of the reasons for that is the elastic deformation of the tip and the sample. For example, the decrease in the organic molecules vertical dimensions was experimentally established. Because these materials are very soft, the probe "indents" protrusions on their surfaces (See Appendix 3 and chapter 2.5.1).
The second reason for the difference between scan profile and real surface geometry is the tip-sample convolution. Its consideration is important when studying small (of the order of the tip curvature radius) surface features. A finite tip dimension results in the lack of the ability to probe narrow cavities on the sample surface thus decreasing their depth and width. Similarly, convex features image appears wider. The convolution phenomenon is best understood from Fig. 1.
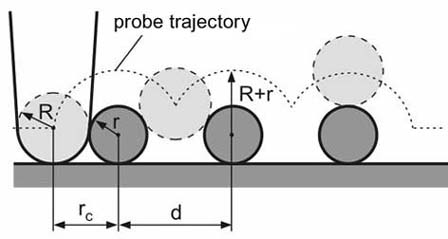
Fig. 1. Tip convolution during scanning. The scan profile can differ much from real surface geometry.
It can be seen that for an object having in reality radius
 the measured dimensions are larger depending on the tip radius (see details in the chapter 2.5.2).
If one assumes the simultaneous effect of convolution and deformation, it becomes clear how much the image profile can differ from the real topography. In Appendix 4 it is demonstrated that the acquired image needs to be analyzed and even computer processed in order to obtain the sample real topography.
Non-elastic conservative contact forces.
As tip makes contact with the sample, some other forces arise besides the elastic one. For example, the Van der Waals interaction (revealed not only when two bodies touch but within some distance between them) leads to the contact pressure decrease because Van der Waals forces in contrast to elastic ones are attractive but not repulsive.
Fig. 2. Plots of force
 vs. penetration depth
 . Shown are the Hertz problem solution as well as solution
with a hysteresis loop accounting for the nonconservative forces.
This alongwith other attractive microscopic interactions (not discussed here) result in the downward shift of the plot (Fig. 3 in chapter 2.2.2.2) which illustrates the Hertz problem solution. As can be seen, at
 the force is negative. This means that as the tip slightly touches the sample, an attractive force acts.
Nonconservative effects.
Besides elastic and Van der Waals forces, some other nonconservative forces exist: from friction to energy dissipation by arising elastic waves ѕ phonones. These forces modify the Hertz problem solution even greater. Let us consider the experimental consequences of such contact interactions.
Particularly, due to the nonconservative forces, the tip adhesion (sticking to the surface) takes place. In this case the touch and separation happen differently, i.e. the hysteresis occurs.
The tip adhered to the surface carries a small "stuck" portion of the sample (during the upward move) which, for some time before separation, goes up producing a neck (Fig. 3).
Fig. 3. "Sticking" of the sample surface portion to the tip is due to
nonconservative forces and results in hysteresis.
Such deformations will be treated as having negative penetration depth
. This means that during the cantilever retraction upward, the mentioned plot (Fig. 2) can shift to the left from the vertical axis until the stepwise separation occurs. In Fig. 2 arrows show the path in
 coordinates when the tip moves down and up.
To describe the left part of the plot one should use more complex (compared to the Hertz model) analytical models. They are examined, e.g. in [1].
The hysteresis loop in the plot means that in order to press the tip into the sample surface and then separate it and bring it back, some work must be done. In other words, if one hits the sample surface with the cantilever, the collision will be non-elastic. In semicontact vibration mode such non-elastic sticking is one of the damping factors.
Summary.
- In order to define critical experiment parameters at which sample or cantilever damage can take place, one should consider elastic properties.
- While scanning, the sample is indented, therefore, to reconstruct the real topography one should account for an elastic deformation.
- At the onset of the tip-sample contact, the other forces besides elastic ones arise including nonconservative such as adhesion.
References.
- Handbook of Micro/Nanotribology / Ed. by Bhushan Bharat. – 2d ed. – Boca Raton etc.: CRC press, 1999. – 859 p.