


New Capabilities of NT-MDT SI AFM Microscopes: Single-Pass Electrostatic Measurements
Application Note 081 (pdf 2 Mb)
Sergei Magonov, NT-MDT Development
Multi-frequency Measurements
- Broad frequency range
Up to 5MHz for photodetector and 3 lock-in amplifiers - Amplitude/Phase Modulation detection of electrostatic tip sample interactions
- Simultaneous measurement
Topography
KPFM
Dielectric Response
SINGLE PASS MULTI-FREQUENCY MEASUREMENTS
Advanced studies of surface potential and dielectric response were performed using single-pass measurement operation with an NT‑MDT SI atomic force microscope (AFM) equipped with a novel electronic controller that allows multi-frequency AFM studies. Sensitive measurements of local electrical properties, with a few nanometers spatial resolution, were realized in practice through phase modulation detection of the electrostatic force gradient. The validity of this approach is demonstrated on several different sample types: self-assemblies of fluoroalkanes and polymers (see Single- Pass Measurements in Atomic Force Microscopy: Kelvin Probe Force Microscopy and Local Dielectric Studies for a full description of samples and capabilities).1
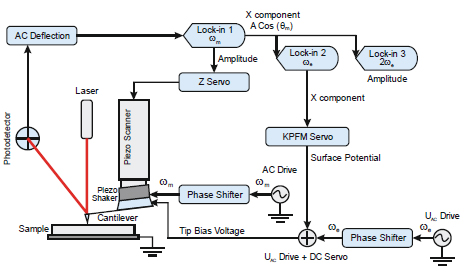
The obtained results have proved the utility of surface potential and dielectric response for compositional mapping of heterogeneous materials. The issues of quantitative surface potential studies are also discussed in the full application note1, which also introduces a novel approach to extract the dielectric permittivity values from AFM data. For AFM based electrical studies the probe is typically coated with a metal layer that enables the detection of electrostatic force interactions with the sample. The separation of mechanical and electrostatic forces is essential for reliable measurements of sample electric properties. On the scheme, bottom left, we demonstrate how this problem is solved in a single pass multi-frequency AFM instrument, which is used for phase modulation detection of surface potential and local dielectric response.
PHASE MODULATION YIELDS FORCE GRADIENT
The stationary solutions of the asymptotic equation describing the force interactions between an oscillatory probe and a sample provide the relationship between the probe parameters (amplitude A, phase θ, position Zc) and the acting force (cosθ ~ FZ).
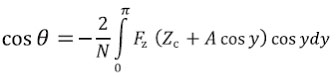
Under the assumption of small amplitude cosθ is proportional to the force gradient.

However, we go beyond this assumption by expressing the integral in its simple closed form [2].
NO CROSS-TALK BETWEEN TOPOGRAPHY AND ELECTRICAL SIGNALS
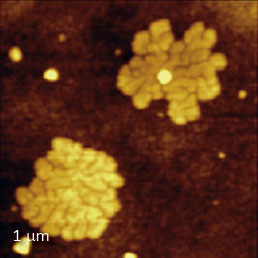
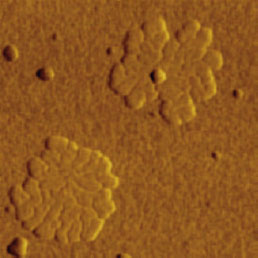
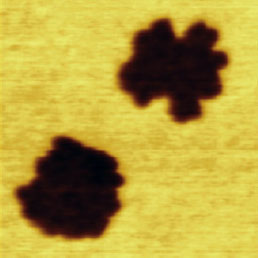
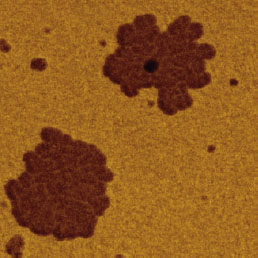
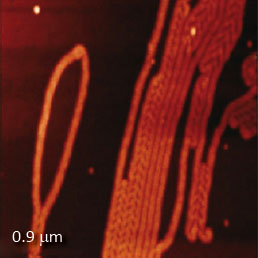
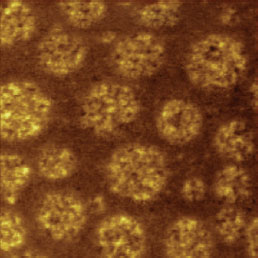
F14H20 adsorbates on silicon yield distinctive surface potential contrast, seen in the surface potential image shown to the right. The negative potential contrast is noticed only at the domains whereas small particles are not visualized in the surface potential image. The lack of small particles in the surface potential data is a strong indication that there is no noticeable crosstalk between the mechanical and electrostatic forces in the single pass operation. The same particles and F14H20 domains are seen in the dielectric response image; this is expected because any material between two electrodes will change the capacitance gradient.
Note that for molecular systems with dipoles, their surface potential is related to the strength and orientation of dipoles (μ) via the Helmholtz formula
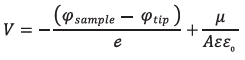
A = Surface area per molecule
SINGLE PASS VS. TWO PASS LIFT
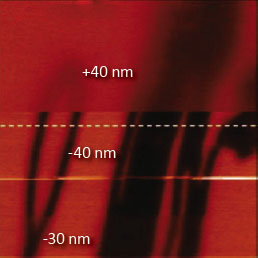
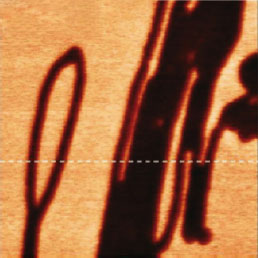
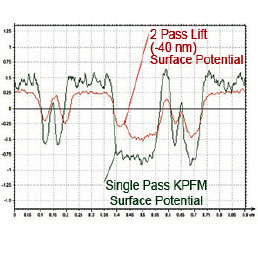
A comparison of the surface potential measurements made using the single pass KPFM-PM (where PM is the phase modulation by the electrostatic force gradient) and a double pass technique was performed with F14H20 assemblies on mica. First, we examined a sample location with single pass KPFM-PM, and then performed the double pass studies using positive (+40 nm) and negative heights (-30 nm, -40 nm) with respect to the average position of the probe. The surface potential difference between the F14H20 selfassemblies and nearby bare substrate regions was approximately -1.4 V in the KPFM-PM image and only around -0.8 V in the double-pass image with a lift of -40 nm. The comparison of the surface potential values obtained using single pass and double pass modes shows that the single-pass method is preferred for KPFM studies.
HIGH SPATIAL RESOLUTION AND SENSITIVITY
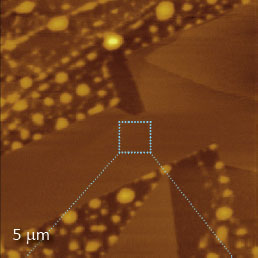
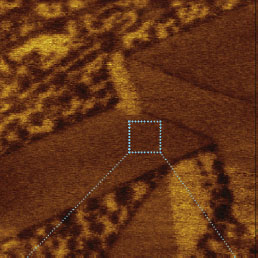
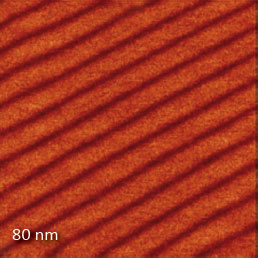
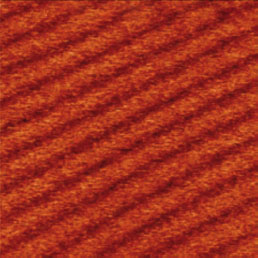
High sensitivity and spatial resolution can be achieved in single pass KPFM-PM studies as demonstrated in the images of F14H20 self-assemblies on graphite. The large scale height image shows a number of flat lamellar sheets and numerous droplets dispersed between them. The non-covered substrate patches are seen as the bright regions in the surface potential image. With the F14H20 adsorbates on graphite, the first layers are formed of molecules, which are oriented parallel to the substrate and form lamellar structures of 6–8 nm in width. The molecular dipoles in these layers are also preferentially oriented parallel to the surface. The high-resolution height and surface potential images (80 × 80 nmscan area) revealed lamellar patterns with height corrugations in the 300 pm range and potential changes in the 10–20 mV range. The spatial resolution of these images, which show the 6 nm spacing, is around a few nm as judged by a width of the dark strips. The nature of the nanoscale surface potential variation is under further investigation.
AFM COMPOSITIONAL MAPPING PLUS CONFOCAL RAMAN
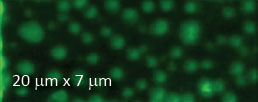
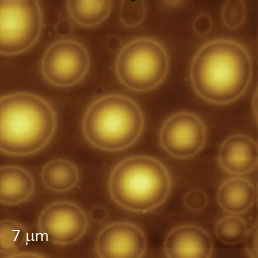
Studies of the PS/PVAC (polystyrene/polyvinylacetate) blend morphology behavior at different temperatures, in methanol vapor as well as previous dielectric measurements suggest that the domains are enriched in PVAC whereas the matrix is predominantly PS. This suggestion is strongly supported by confocal AFM Raman studies. The Raman spectra of the individual polymer components show that the most pronounced bands of PS (~1018 cm-1) and PVAC (~2959 cm-1) are located in different parts of the vibrational spectra. Therefore, these bands can be used for identification of these components in the blend. The height image of one location of a PS/PVAC film is shown together with the maps of intensity of the strongest PVAC and PS bands. This data unambiguously supports the assignment of spherical domains to PVAC and the matrix to PS.

DIELECTRIC RESPONSE IMAGING
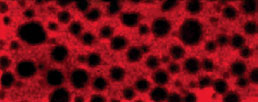
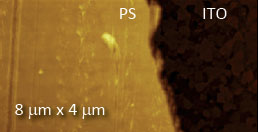
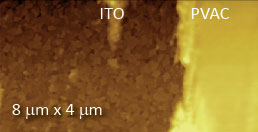
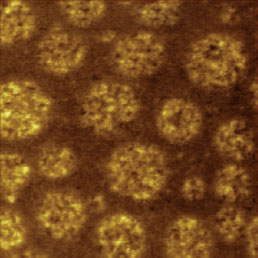
The multi-frequency measurements provide several ways of detecting the capacitance gradient changes which are related to the local dielectric properties. A comparison of topography and dC/dZ images of a PS-PVAC blend shows that the pattern of dielectric response is rather complex and by comparison differs from the binary contrast surface potential map of this blend shown above. In the development of quantitative dielectric measurements we explored the amplitude of cosθ at 2ωelec images of neat polystyrene and neat PVAC films on ITO glass. These measurements were performed under ambient conditions at the film edges shown on the right. The cosθ contrast obeyed the expected quadratic dependence on the stimulating voltage but the extraction of the dielectric permittivity (εr) data from these results is not trivial due to their complex relationship generally expressed as:
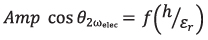
where h is the polymer film thickness. Analysis of the amplitude cos data was conducted using the precise expression. The obtained εr values for these films were in the range of (1.5-3) with the PVAC permittivity ~1.4 times higher than PS film [3]. Permittivity changes are expected near the glass transition temperature of polymers. In this case the relation between the amplitude and phase of cosθ signal and complex permittivity should be considered.

REFERENCES
- Single-Pass Measurements in Atomic Force Microscopy: Kelvin Force Microscopy and Local Dielectric Studies. NT-MDT White Paper, 2012.
- S. Belikov, and S. Magonov “Classification of Dynamic Atomic Force Microscopy Control Modes Based on Asymptotic Nonlinear Mechanics” Proceedings American Control Society, St. Louis, 979-985, 2009.
- S. Belikov, J. Alexander, S. Magonov, and I. Yermolenko “Atomic force microscopy control system for electrostatic measurements based on mechanical and electrical modulation” Amer. Control Conf. 2012, submitted.