


Imaging of biological samples in liquid environment
Application Note 080 (pdf 890 Kb)
Tibor Füzik, Pavel Ulbrich, Tomas Ruml
Institute of Chemical Technology Prague, Department of Biochemistry and Microbiology,
Technicka 5, Prague, Czech Republic, 166 28
This short review describes the possibilities of imaging of biological materials using atomic force microscopy (AFM) in liquid environment. During the years, AFM became a promising method for imaging of properly prepared soft materials, that were usually hardly visualized by other methods. Atomic force microscopy can give new insight on biological matter, because it can work in environment close to native for the living cells, bacteria and viruses.
INTRODUCTION
This application note focuses on scanning of biological samples in liquid environment. It covers the basics of proper tip selection, scanning modes and procedures needed to properly tune the cantilever in semi-contact mode as well as the necessities that are needed to be done before successful imaging in liquid. These advices can be followed also for non biological samples. In the second part of the document, we focus on the possibilities of the AFM usage for imaging of biological samples in liquid.
CONTACT VS SEMI-CONTACT MODE
The most common AFM techniques used in imaging of biological samples in liquid are the contact and semi-contact (amplitude modulation) modes. Whereas scanning in contact mode works very similar like in air, the semi-contact mode needs more skills to achieve the desired result. The contact mode is used mainly for stiff and firmly attached samples, or samples where the features under soft layer can be visualized using this method. However, because of soft and fragile nature of the majority of biological samples the semi-contact mode is more suitable for these kinds of samples.
Nowadays the two major ways of scanning are scanning with tip or scanning with sample. In some cases, the scanning with tip is the only reasonable method, when the sample cannot be attached to the scanner or the configuration of AFM with an optical microscope is used. This scanning technique can adopt wide range of samples and sample holding surfaces (i.e. Petri dishes) where the lateral size of the sample is often not a limiting factor. Scanning with tip usually provides a less stable environment, and is less suitable for high resolution imaging. However, where the resolution and the thermal stability is not the key of the experiment, scanning with tip can be successfully used.
Scanning with sample is preferred method for high resolution imaging. In this case the tip holder with the tip remains steady and the scanning movement is provided by the scanner with sample. The wet cell attached to the scanner is designed in a way to minimize the movement of the sample inside the cell and to decrease the thermal instabilities. The design of the liquid cell often limits the observation of some samples that cannot fit into it, nevertheless, for high resolution imaging the properly designed liquid cell greatly decreases the noise affecting the final measurements.
PROBES
The proper selection of AFM probe is the most important for any type of scanning. In case of scanning of biological sample in liquid it is crucial to select the probe that is the most suitable for the particular experiment.
For scanning in air, the most widely used probes are manufactured from silicon. These silicon tips with silicon cantilevers provide a very well defined conical shape with tip height of ∼10-15 µm. The radius of the tip apex is usually 10 nm or less. This provides very sharp and well defined images while scanning in air, however, these tips are usually not suitable for scanning in liquids. The main drawback is the stiffness of the cantilever. The high spring constant of the silicon cantilever does not allow light semi-contact imaging in the liquid.
For this reason the silicon nitride cantilevers with pyramidal silicone nitride tips are the preferred probes in liquid environment imaging. The silicone nitride cantilevers have very low spring constant that allows not only semi-contact scanning but contact mode scanning as well. Silicone nitride has great durability and the tips suffer less of wear than silicon tips, however, the drawback of these tips is the height of the tip (∼2,5 µm) and the sharpness of the tip apex, that is usually ∼20-60 nm for non sharpened tips, which limits the resolution. The solution is the use of oxide sharpened silicon nitride tips where the tip apex radius goes down to ∼10 nm and great results with high resolution can be achieved.
The last class of probes suitable for liquid imaging are the newly developed silicon/silicone nitride probes. These probes combine the advantages of both above mentioned probes. The cantilever of the probe is fabricated of soft silicon nitride and the tip is made of silicon. Declared sharpness of the tip goes well below 10 nm which ensures great resolution.
TUNING OF CANTILEVERS FOR SEMI-CONTACT MODE
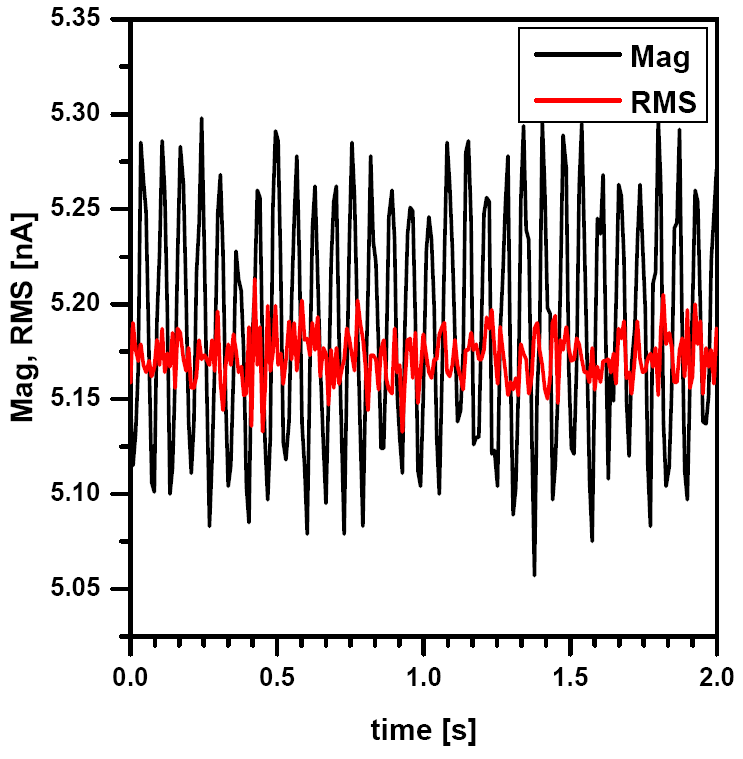
For semi-contact mode in liquid, the first option to optimize is the proper choose of feedback signal. In liquid the preferred is the RMS signal from the photo detector, because it gives less noise at low frequencies than the magnitude signal which is amplified by lock-in amplifier (see Fig.1). To ensure proper range of RMS values, preamplifier can be used (x10), which rises the values of the RMS to the level that the set point value can be adjusted more precisely.
Also for the excitation of the cantilever in liquid environment a higher generator voltage must be applied (from 1-10 V), to achieve proper cantilever resonance. Too low generator voltage can lead to improper tuning, that's why, maximum value is recommended. Afterwards, it can be lowered to the desired amplitude.
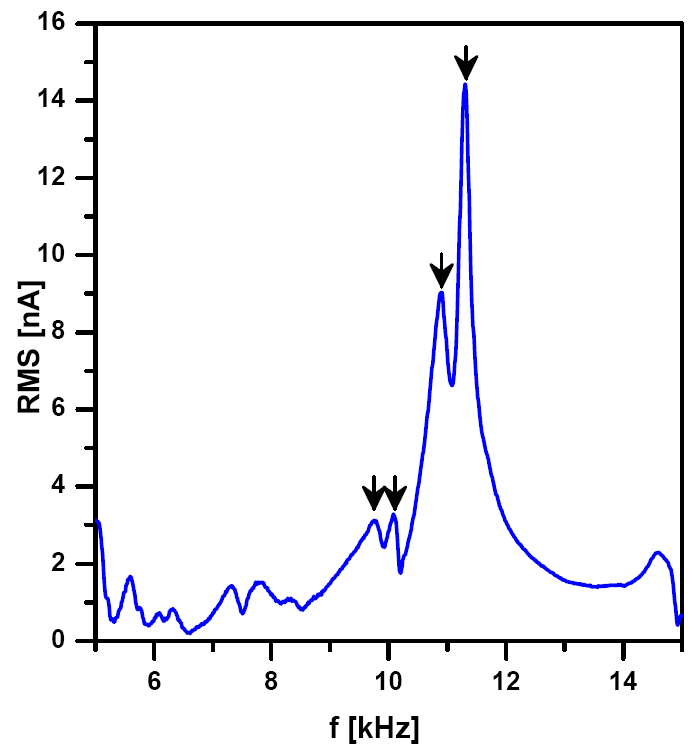
The resonance frequency of the cantilever in liquid is usually an order of magnitude lower than in air and is located bellow 20 kHz. Auto-tuning is not recommended in liquid, because in contrast with resonance frequency in air there is not only a single peak in liquid environment (see Fig.2). After initial frequency sweep (from 5-20 kHz), multiple peaks appear on the plot. It must be noted that the resonance frequency of the tip in liquid is not only a property of the tip, but rather of the entire environment. The selection of proper peak can be a challenge for beginners and would resemble more art than science. There are several recommendations for the proper selection:
- choose a peak that is higher than the majority of the peaks (but not always the highest peak is the best)
- after landing in contact mode and when the tip is still in contact with the sample, check that the height of the peak decreased
- once the proper peak was selected for the cantilever, it usually remains very similar for the other cantilevers of the same type (and the same instrument setup) - this can serve as a guide to select the proper peak for the next time
APPROACHING THE SAMPLE SURFACE IN LIQUID
Approaching the sample surface can be also challenging in the liquid environment. While the procedure of approaching the sample surface does not dier signicantly from the approaching in air in contact mode, in semi-contact mode it can be quite challenging. For beginners it is recommended to approach the surface in contact mode, than to switch to semi-contact mode, however, sometimes (in case of soft and sticky samples) this procedure can lead to tip contamination. To avoid this problem, approaching the sample surface in semi-contact mode is recommended.
Approaching in semi-contact mode in liquid differs from the approaching in air. At the beginning the amplitude of the cantilever starts to rise while getting closer the surface, than it starts to decrease. That is because the intensity of the acoustic waves in the liquid diers when the tip holder and the tip is closer to the sample surface. Thus, during the approaching process the amplitude gradually increases until a certain point where the tip reaches the liquid in close surrounding of the sample, while it is still not in contact with the sample. This causes a decrease of amplitude, however, this decrease is not suitable for imaging. After getting even closer the tip comes in contact with the sample with a sudden drop of its amplitude.
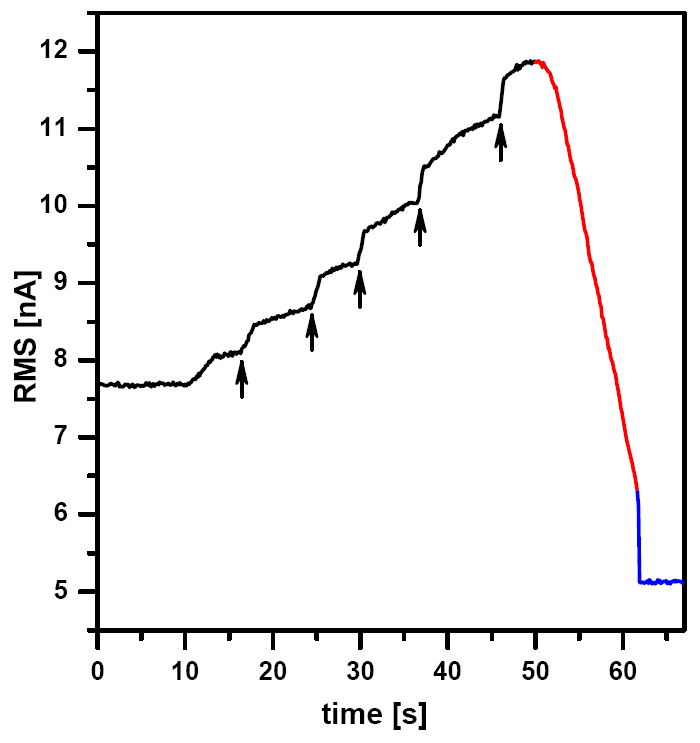
Fig.3, a typical response curve of the cantilever (RMS signal) can be seen during the process of approaching. At the beginning, the rising amplitude of the cantilever slows down the approaching speed (controller switches to ne approach mode) and that is why the approaching procedure needs to be several times restarted (marked with arrows). When the cantilever comes very close to the surface the amplitude starts to decrease. This mild decrease does not mean that there is a contact with the sample surface. At the end, there is a sudden drop in the amplitude, hitting the applied set point, which means that the tip reached contact with the sample. As well as the tuning, the landing procedure needs also some training and a good sense to set a proper set point and feedback gain.
After proper approach to the surface has been done, it is advisable to retune the cantilever which can slightly change its resonance frequency, when it is very close to the surface.
AMPLITUDE OF THE CANTILEVER
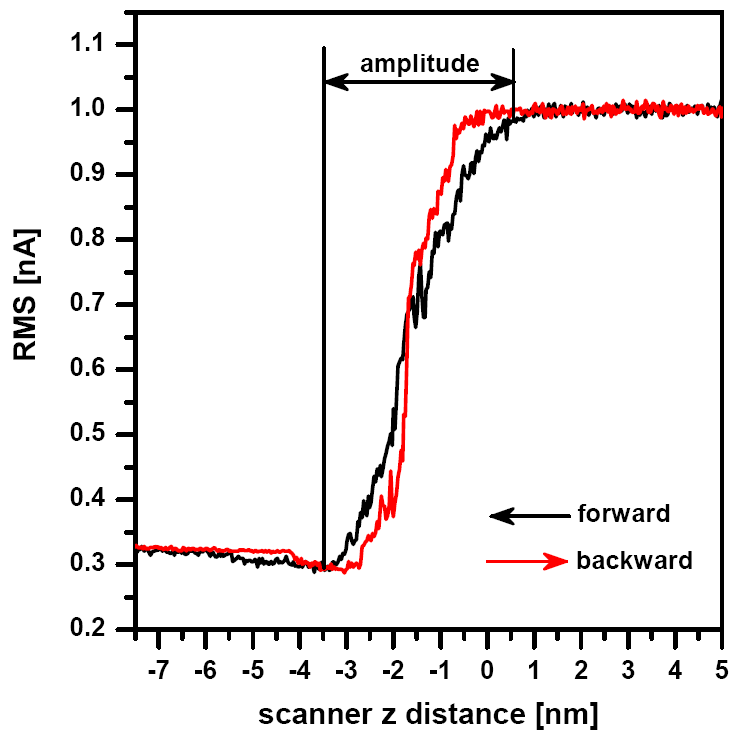
To check the amplitude of the cantilever in liquid a similar procedure as in air can be performed. A basic amplitude distance curve can help to set the generator output level to set the proper amplitude of the cantilever. Therefore, also the force applied by the tip to the sample during the scanning. The amplitude distance curve may also help to determine whether the tip is in proper contact with the surface. If the amplitude does not change with the distance, there is not a proper contact with the sample. There are only small diferences between the amplitude distance curves in air and in liquid (see Fig.4).
PARAMETERS OF IMAGING IN LIQUID ENVIRONMENT
Typical tuning of scanning parameters in liquid does not difer from the scanning in air. Proper set of feedback gain, set point, amplitude and speed of scanning are the key factors for the best results.
As it was mentioned in the previous chapter, cantilevers amplitude can be estimated using amplitude/distance curves. The proper amplitude for the scanning depends on the height of features on the surface. The higher the features of the scanned sample, the higher amplitude is recommended, however, the higher amplitude the higher force on the sample is applied, which can be critical for the soft biological samples. For relatively at and stable samples 10-50 nm amplitude is a good starting point.
Set point and the feedback gain are maybe the most important parameters of scanning during the imaging process. For a good non sticky sample the feedback gain can be set up to 1, however the range of values 0.5-0.7 are more reasonable for the majority of samples. In case of some samples, it must be extremely decreased, but on small scanning range it is not necessarily a problem. As wel as the amplitude of the scanning, the set point also denes the force applied to the sample by the tip. The lower the set point the higher the force applied. Usually 80-90% of the free amplitude is a good starting point, or you can gradually decrease the set point until clear image appears.
Often, the set point must be repeatedly decreased during the scanning to keep the image stable. This is caused by the bending of the cantilever in the liquid. A cantilever that is not thermally equilibrated has a tendency to bend during the scanning process. This leads to movement of the laser spot from the center of the photodetector, which causes decrease of the amplitude signal (not the real amplitude!), therefore the set point must be decreased to maintain the same scanning force. To avoid this drift, a longer equilibration time is recommended before the high resolution scanning takes place.
The speed of scanning depends not only on the reaction time of the feedback loop (causing tailing), but also the stickiness of the sample must be considered. On some samples a slow scanning speed causes permanent sticking of the tip to the surface, which leads to problems of imaging. In this case a faster scanning can solve the problem, although sometimes at the cost of resolution.
BASIC PREPARATION OF BIOLOGICAL SAMPLES
Viruses
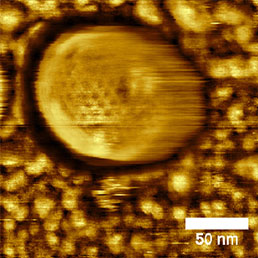
Size of the viruses predetermines them to be investigated mainly by electron microscopic methods. However, these methods rarely investigate the virus in its native form and often undesirable staining and dehydration of the sample is needed. The main advantage of atomic force microscopy in such samples is its ability to perform the scanning in liquid environment. In liquid, the pressure applied by the tip to the virus particles can be precisely controlled and often the structure of the sample surface can be directly visualized (see Fig.5)

a)
b)
To date, many articles describing the scanning of the virus particles from the smallest (i.e. rhinoviruses [1]), to the biggest ones (the giant mimivirus [2]) have been published. These papers investigate not only the surface structure of the viruses, the process of crystallization of viral particles [3, 4] which is often visible, but also mechanical properties [5].
The main problem in scanning of viral particles is usually their attachment to the scanning surface. This is usually based on electrostatic principle, achieved by polylysine coated surface [2, 6] or multivalent metal cation [7]. Attachment to silane modied mica surfaces [8], or silane modied silicon wafers with immobilized antibodies [9] has been also reported.
The buered environment with controlled ionic strength and pH can not only serve to achieve high resolution images [10], but also to investigate the stability of particles in diferent conditions, and to simulate the release of their genome depending on the properties of the environment [1].
Bacteria
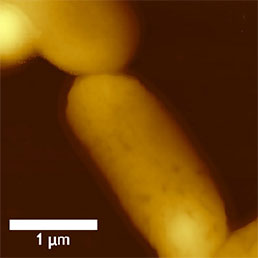
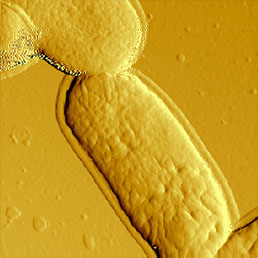
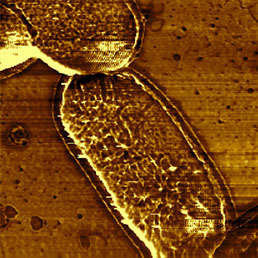
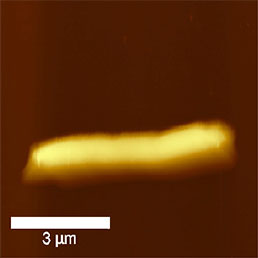
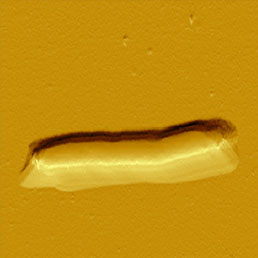
The size of bacteria is usually almost an order higher than the size of virus particles. The easiest way to visualize bacteria by AFM is scanning in air. Sample immobilization is as simple as to dry the suspension of bacteria onto a glass cover slip or mica surface. Using this method the bacteria are immobilized rmly enough to scan them even in contact mode, however, semi-contact mode is preferred where even the amplitude or phase can be recorded (see Fig.6).
a)
b)
c)
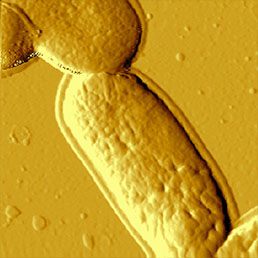
d)
To immobilize the bacteria for scanning in liquid environment special surfaces must be prepared. Immobilization techniques using gelatin coated mica surfaces has been reported [11], however, probably the most straightforward way is to immobilize them on polylysine coated glass or mica [12]. Although usually the resolution of biological samples is better in liquid than in air [13], in the case of bacteria this is not true. It seems that in liquid environment, the cell wall of bacteria is more smooth and less striae can be found on it than in images obtained in air (Fig.7). This can be explained by the fact that during the drying process some part of the cell wall dries out and thus is more rigid than in natural liquid environment, where the dynamics of the surface compartment can be preserved. Also the geometry of silicon nitride tips introduces scanning artefacts at the steep edges of the bacteria, where tip-broadening happens [14].
While AFM scans only features on the surface of the bacteria, which is coated by cell wall, there have been several reports of using it to check effect of antibiotics [15] on the cell wall or in situ treatment of cell wall with lysozyme [12].
a)
b)
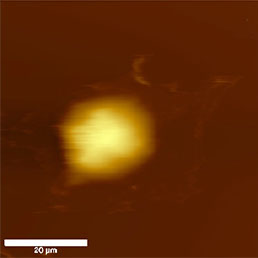
Tissue cell cultures
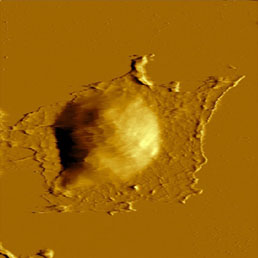
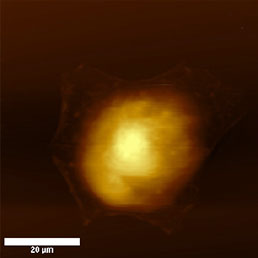
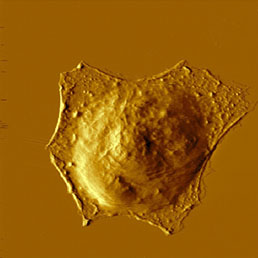
Cell cultures are usually the biggest samples used in AFM investigations of biological samples. Their lateral size exceeds tens of µm and vertical size depending on the cell line can be several µm. They are one of the softest materials for scanning because they lack cell wall and the naked plasmatic membrane comes in contact with the AFM probe. Because of the fragility and the nature of tissue cells, these samples should be measured in liquid environment, because during drying they loose their natural features.
The diculty of sample immobilization depends on the nature of the cell line. Adherent cell lines can be easily immobilized by growing them directly on a glass cover slip. For the attachment of suspension cell lines polylysine coated glass surfaces can be used.
Because the cell membrane is very soft, less sharp probes (i.e. non sharpened silicon nitride probes) are recommended for imaging of living unxed cells to prevent tearing of the membrane. Softness of the membrane allows even visualization of the cytoskeleton underneath the cell membrane (Fig.8). This can be achieved easily in contact mode, where the increasing force applied to the tip enables visualization of the cytoskeleton under the cell membrane appears [16], but also in semi-contact mode by great reduction (40%) of free amplitude [17].
To enhance the stiness of the cells, xation methods could be applied. The most common is to x proteins using formaldehyde or glutaraldehyde (see Fig.8) and the lipids in the cell membrane by OsO4. The later makes the membranes stiff enough to visualize their surface structure [18], while in unxed state the membrane is too fluid and soft for visualization of small details. These dierences could be detected not only on the topography image but on amplitude, phase and on second harmonics image as well [19].
Using AFM, release of viral particles from tissue cells can be visualized [18], and also real-time monitoring of virus release through the cell membrane can be monitored [20].
a)
b)
a)
b)
CONCLUSION
Although atomic force microscopy was developed mainly to study surfaces of rigid and well defined materials, during the years of development it has become an invaluable tool for investigating soft biological materials. In this application note we briefy described possibilities of imaging of biological material as virus particles, bacteria and cell cultures using atomic force microscopy in liquid environment.
REFERENCES
[1] F. Kienberger, R. Zhu, R. Moser, D. Blaas, and P. Hinterdorfer, \Monitoring RNA Release from Human Rhinovirus by Dynamic Force Microscopy," Journal of Virology, vol. 78, pp. 3203-3209, Mar. 2004.
[2] Y. G. Kuznetsov, C. Xiao, S. Sun, D. Raoult, M. Rossmann, and A. McPherson, \Atomic force microscopy investigation of the giant mimivirus.," Virology, vol. 404, pp. 127-137, May 2010.
[3] Y. Kuznetsov, A. Malkin, R. Lucas, and A. McPherson, \Atomic force microscopy studies of icosahedral virus crystal growth.," Colloids and surfaces. B, Biointerfaces, vol. 19, pp. 333-346, Dec. 2000.
[4] A. J. Malkin, Y. G. Kuznetsov, R. W. Lucas, and A. McPherson, \Surface processes in the crystallization of turnip yellow mosaic virus visualized by atomic force microscopy.," Journal of structural biology, vol. 127, pp. 35{43, Aug. 1999.
[5] M. G. Mateu, \Mechanical properties of viruses analyzed by atomic force microscopy: a virological perspective Virus research, vol. 168, pp. 1-22, Sept. 2012.
[6] Y. G. Kuznetsov, P. Ulbrich, S. Haubova, T. Ruml, and A. McPherson, \Atomic force microscopy investigation of MasonPzer monkey virus and human immunode ciency virus type 1 reassembled particles," Virology, vol. 360, pp. 434-446, Apr. 2007.
[7] F. Kienberger, R. Zhu, R. Moser, C. Rankl, D. Blaas, and P. Hinterdorfer, \Dynamic force microscopy for imaging of viruses under physiological conditions.," Biological procedures online, vol. 6, pp. 120-128, Jan. 2004.
[8] Y. Lyubchenko, P. Oden, D. Lampner, S. Lindsay, and K. Dunker, \Atomic force microscopy of DNA and bacteriophage in air, water and propanol: the role of adhesion forces," Nucleic Acids Research, vol. 21, no. 5, pp. 1117-1123, 1993.
[9] M. Moloney, L. McDonnell, and H. O'Shea, \Immobilisation of Semliki forest virus for atomic force microscopy," Ultramicroscopy, vol. 91, pp. 275-279, May 2002.
[10] D. Muller, D. Fotiadis, S. Scheuring, S. Muller, and A. Engel, \Electrostatically balanced subnanometer imaging of biological specimens by atomic force microscope," Biophysical journal, vol. 76, no. 2, pp. 1101-1111, 1999.
[11] M. J. Doktycz, C. J. Sullivan, P. R. Hoyt, D. a. Pelletier, S. Wu, and D. P. Allison, \AFM imaging of bacteria in liquid media immobilized on gelatin coated mica surfaces.," Ultramicroscopy, vol. 97, no. 1-4, pp. 209-16, 2003.
[12] A. Bolshakova, O. Kiselyova, A. Filonov, O. Frolova, Y. Lyubchenko, and I. Yaminsky, \Comparative studies of bacteria with an atomic force microscopy operating in dierent modes," Ultramicroscopy, vol. 86, pp. 121-128, Jan. 2001.
[13] Y. L. Lyubchenko and L. S. Shlyakhtenko, \Visualization of supercoiled DNA with atomic force microscopy in situ.," Proceedings of the National Academy of Sciences of the United States of America, vol. 94, pp. 496-501, Jan. 1997.
[14] S. B. Velegol, S. Pardi, X. Li, D. Velegol, and B. E. Logan, \AFM Imaging Artifacts due to Bacterial Cell Height and AFM Tip Geometry," Langmuir, vol. 19, pp. 851-857, Feb. 2003.
[15] P. C. Braga and D. Ricci, \Atomic force microscopy: application to investigation of Escherichia coli morphology before and after exposure to cefodizime.," Antimicrobial agents and chemotherapy, vol. 42, pp. 18-22, Jan. 1998.
[16] C. Le Grimellec, E. Lesniewska, M. C. Giocondi, E. Finot, V. Vie, and J. P. Goudonnet, \Imaging of the surface of living cells by low-force contactmode atomic force microscopy.," Biophysical journal, vol. 75, pp. 695-703, Aug. 1998.
[17] F. Kienberger, C. Stroh, G. Kada, R. Moser, W. Baumgartner, V. Pastushenko, C. Rankl, U. Schmidt, H. Muller, E. Orlova, C. LeGrimellec, D. Drenckhahn, D. Blaas, and P. Hinterdorfer, \Dynamic force microscopy imaging of native membranes.," Ultramicroscopy, vol. 97, no. 1-4, pp. 229-37, 2003.
[18] Y. G. Kuznetsov, J. G. Victoria, W. E. Robinson, and A. McPherson, \Atomic force microscopy investigation of human immunodeciency virus (HIV) and HIVinfected lymphocytes.," Journal of virology, vol. 77, pp. 11896-909, Nov. 2003.
[19] A. Dulebo, J. Preiner, F. Kienberger, G. Kada, C. Rankl, L. Chtcheglova, C. Lamprecht, D. Kaftan, and P. Hinterdorfer, \Second harmonic atomic force microscopy imaging of live and xed mammalian cells.," Ultramicroscopy, vol. 109, pp. 1056-60, July 2009.
[20] M. Gladniko and I. Rousso, \Directly monitoring individual retrovirus budding events using atomic force microscopy.," Biophysical journal, vol. 94, pp. 320-6, Jan. 2008.