


Comprehensive Compositional Imaging of Heterogeneous Materials with Atomic Force Microscopy
Application Note 097
 (6 Mb)
Sergei Magonov and Marko Surtchev
NT-MDT Development Inc., Tempe, AZ 85284 USA
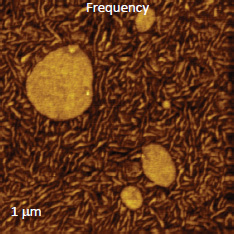
Frequency image of PS/LDPE blend
- Compositional imaging of heterogeneous materials with AFM is one of invaluable applications of this method in academy and industry.
- Visualization of specific structures and probing of local properties (mechanical, electric, thermal, spectroscopic, etc.) are employed for AFM compositional imaging.
- Experimental data on polymer blends and bitumen illustrate the high-resolution mapping of different components of complex materials.
INTRODUCTION
Distinguishing of individual constituents in complex materials is one of the primary tasks of microscopy that is achieved by visualization of specific shapes and features of components. Electron microscopy and atomic force microscopy (AFM) [1] extend visualization of objects down to the atomic scale thus enhancing compositional imaging. The situation becomes less trivial when the constituents lack definite structures either being amorphous by nature or covered by contamination or oxide layers. In such cases one can use mechanical, electromagnetic, thermal, or spectroscopic responses of components for their identification. Probing of these properties can be performed using AFM-related techniques with high sensitivity and nanometer-scale spatial resolution. The latter is important as functional structures are continuously shrinking in dimensions.
Since the introduction of AFM its capabilities have substantially expanded beyond high-resolution visualization of surface structures. Probing of the tipsample mechanical [2] and electrostatic [3] interactions was first demonstrated at single surface locations, and later extended to mapping of the elastic modulus, work of adhesion, surface potential, dielectric response, etc., simultaneously with topography imaging. The current arsenal of AFM modes helps a practitioner to optimize compositional imaging by selecting the most suitable techniques. Below, we will overview probing different sample properties with AFM methods and will provide examples of compositional imaging of polymer blends and complex natural compound – bitumen.
PROBING LOCAL MATERIALS PROPERTIES
Contemporary AFM is based on several imaging techniques such as contact mode, oscillatory resonant and non-resonant modes. These modes have the offshoots for examination and mapping of different materials properties. In contact mode, which was the pioneering AFM method, the cantilever deflection is used for imaging, and probing of the mechanical properties is performed by recording deflection-versus-distance (DvZ) curves and by monitoring the cantilever’s twist caused by variations of lateral forces. Quantitative mechanical properties can be extracted from DvZ curves. By adding a dynamic excitation of the probe (either at low frequencies below the probe resonance or at its contact resonance) the periodical response of the probe amplitude or frequency can reveal the alternations of mechanical properties and dissimilar surface areas. When the electrostatic force between a conducting probe and electro-active sample is excited, the related probe response can reflect the local electric or electromechanical properties.
AFM applications to soft materials became routine with the introduction of resonant amplitude modulation (AM) mode, which is assisted by phase imaging (AM‑PI) or by frequency imaging (AM-FI).
In this mode, an amplitude drop, either at initial probe resonance (AM-PI) or at effective probe resonance changing with tip-sample interactions (AM-FI), is used as feedback for surface profiling. In such approach the non-desirable shearing forces common to contact mode are reduced. However, in the resonant AFM modes, an extraction of DvZ curves, which are needed for calculation of local mechanical properties, is a complicated task. At present, the phase or frequency contrasti n AM-PI and AM-FI provides valuable qualitative data about sample mechanical properties, and it is often employed for compositional imaging. For gentle profiling of soft samples we are applying one more resonant mode – Frequency Modulation (FM), which allows stable imaging in pure attractive force operation.
Sensitive detection of local electric properties (surface potential, dielectric response, etc) is achieved in singlepass techniques [4] associated with AM-PI mode. The excitation and detection of electrostatic force/force gradient during scanning is realized at frequency lower than the probe resonance. In this way, a convolution of mechanical and electrostatic forces is avoided, and they are simultaneously measured at different frequencies.
Our HybriD ModeTM [5] is the AFM technique, which incorporates the feedback of contact mode and oscillatory drive at frequency below the probe resonance. In each cycle of this mode, the probe is brought into intermediate contact with a sample and the cantilever bends to a preset level. The high speed acquisition of DvZ curves and their fast analysis provide elastic modulus and work of adhesion values. Quantitative mapping of elastic modulus of polymers has been demonstrated with 10-20 nm spatial resolution in the framework of solid-state elastic deformation models [6]. Such nanomechanical studies enhance compositional imaging.
Below, we illustrate how the quantitative mechanical measurements in HybriD ModeTM and electric studies in single-pass AM mode are applied for examination of polymer blends.
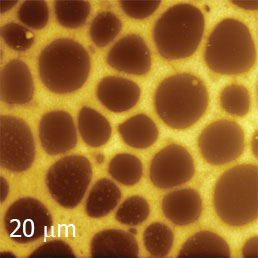
Figure 1. Height image of spin-cast film of PS/LDPE blend
IMMISCIBLE POLYMER BLENDS
Blending of polymers is essential technological procedure for preparation of novel plastic materials. The examination of blend morphology is invaluable for such developments.Blends of atactic polystyrene (PS) with polyethylenes (PE) and poly(vinyl acetate) - PVAC were selected for illustration of compositional imaging. These blends are immiscible, and they undergo phase separation in films prepared from a common solution. PS and PVAC are amorphous polymers, which are characterized by glass transition temperature (Tg) of 100 °C and 40 °C, respectively. At temperatures below Tg these polymers are in glassy state.They become viscoelastic in Tg region and rubbery at high temperatures. For AFM studies, a film of PS/PVAC blend was prepared by spin-casting of their toluene solution on a conducting glass (ITO) substrate.
olymer crystallization is never complete, and lamellae are typically embedded in amorphous polymer. PE is a semicrystalline polymer, which crystallizes by a multiple chain folding that leads to a formation of lamellae.
The folding progresses best for linear chains in dilute polymer solutions. This process is substantially restricted in case of branched chains and during crystallization in melt. Linear PE chains form high-density material HDPE with crystallinity of ~70%. Its crystalline part melts at 130 °C. PE materials, which are formed of chains with short and long branches, are connoted as linear low-density PE (LLDPE) and low-density PE (LDPE). Crystallinity of LLDPE and LDPE is below 50%, and they melt at 100 °C - 120 °C. Amorphous component of PE materials is characterized by Tg < -100 °C. Therefore, in PE samples at room temperature the crystalline lamellae are embedded into rubbery amorphous material. For AFM studies, we have prepared binary blends of PS with LDPE, LLDPE and HDPE by mixing the components in hot xylene solution. Their films were prepared by spin-casting of this solution on Si substrate.
MORPHOLOGY OF PS/PE BLENDS
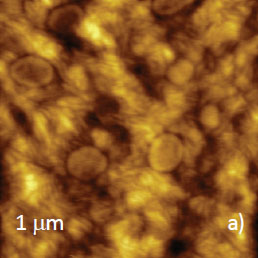
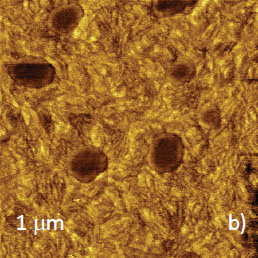
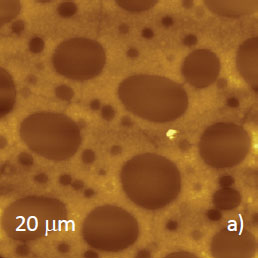
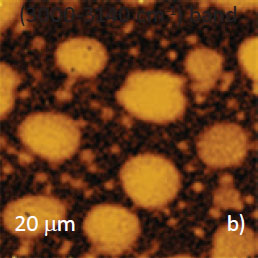
Large-scale morphology of PS/LDPE film is characterized by alternative mesas and valleys, which are several microns in dimensions, Figure 1. Surface corrugations of these regions are around 100 nm. This morphology is common for immiscible blends, and smaller locations on the elevated and depressed areas were examined in different AFM modes. In examination of one top region with AM‑FI mode the images were obtained at different set-point amplitudes (Asp), Figure 2.
In this mode the lowering of Asp leads to stronger tip-sample force that influences the image contrast. At low force the chosen location is characterized by a smooth surface morphology with several small features as seen in height and phase images, Figures 2a‑b. At higher force, the images were transformed into the pattern (Figures 2c-d) with a detailed structure.
Height
Frequency
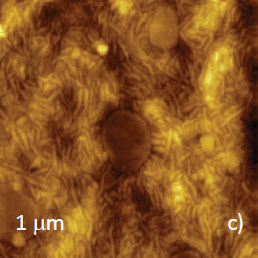
Height
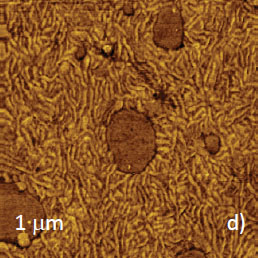
Frequency
Both high-force images show several domains imbedded into a matrix, whose structure is formed of arrays of linear and slightly banded bright strips. The width of the strips (~20 nm) allows assigning them to edges of PE lamellae. They are separated by dark interfaces that characterize amorphous polymer. The featureless domains represent the amorphous PS.
By analogy with phase images in AM-PI mode, the contrast of frequency images depends on a number of factors [7] and can be reversed as seen from a comparison of Figure 2d with the image on the 1st page. This complicates the analysis of phase and frequency images.
Height
Deformation
Elastic Modulus
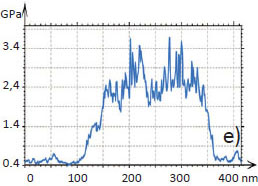
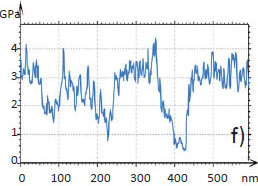
A reliable conclusion regarding the blend morphology can be drawn from quantitative maps of elastic modulus recorded in HybriD ModeTM. The height image and deformation map (Figures 3a-b) were obtained on one of mesas of PS/LDPE film. The deformation map points that the domains are stiffer than the matrix. The elastic modulus map, which was constructed from the analysis of DvZ curves using DMT elastic model, is shown in Figure 3c. As macroscopic elastic modulus of PS (~3 GPa) is higher than that of LDPE (0.2-0.5 GPa), we can assign the domains to PS and the matrix to LDPE. The bright features of the matrix are related to LDPE lamellar structure, which is better resolved in the higher magnification height image and elastic modulus map in Figure 4a-b.
We have also performed HybriD ModeTM studies at one valley location. Its morphology is characterized by the raised round-like domains scattered over a flat surface, Figure 4c. According to the elastic modulus map these softer domains can be assigned to LDPE and the surrounding stiffer areas to PS. The elastic modulus profiles (Figures 4e-f), which were taken across the white dashed lines in the maps, confirm our suggestions. The moduli of the domain in Figure 4b and the flat areas in Figure 4d are close to macroscopic modulus of PS. The lamellar areas (Figure 4b) and domains (Figure 4d) exhibit moduli similar to that of LDPE. Individual lamellae of this polymer are resolved in the modulus map, Figure 4b. This observation underlines the nanoscale resolution of quantitative mechanical studies in HybriD ModeTM.
In last 10 years, compositional imaging has been enhanced with introduction of combined AFM/Raman and AFM/IR techniques. Therefore, chemically different species of complex materials can be recognized by selective Raman scattering or IR adsorption of particular chemical groups. In Figures 5a-c the large-scale height image of PS/LDPE film is shown together with the maps of PS- and LDPE-specific Raman bands.A comparison of the height image with the Raman maps confirms the assignment of valleys to PS and mesas to LDPE. The important feature of spectroscopic studies is the spatial resolution that can be far beyond diffraction limit of IR and visible light applied in these techniques. For carbon materials AFM/Raman method provides 10-20 nm resolution in tip-enhanced studies with special probes.
This option is not yet realized for polymers. In AFM/IR technique the lamellar-scale resolution was achieved for block copolymers. However, distinguishing the crystalline and amorphous regions in semicrystalline polymers is not demonstrated, most likely, due to small spectroscopic changes reflecting crystallinity. This is in contrast with elastic modulus mapping, in which lamellar structures of 10-20 nm in size are routinely resolved. Therefore, compositional imaging might require the use of different AFM methods.
As mentioned above, there is variety of PE materials, and the examples of compositional imaging of PS/LLDPE and PS/HDPE blends are shown in Figures 6-7. Sub-micron surface structure of PS/LDPE is seen in height and phase images recorded in AM-PI mode, Figures 6a-b. Both images exhibit granular surface structures, and the phase contrast suggests that the bright domains are dissimilar with their surroundings.
This is confirmed by HybriD ModeTM study (Figures 6c‑d), in which the probe exerts a stronger force and depresses soft surface structures. This made lamellar structures visible, particularly, in the elastic modulus map, Figure 6d. Therefore, the matrix is enriched in LLDPE. The circular domains, which are bright in the phase image, exhibithigher modulus and can be assigned to PS.
Height

Elastic Modulus
Height
Elastic Modulus
Elastic Modulus
Elastic Modulus
Height
Map of PS
Map of LDPE (2800‑2990 cm‑1) band
Height
Phase
Height
Elastic Modulus
(c-d) Height and elastic modulus map recorded on the same location in HybriD ModeTM
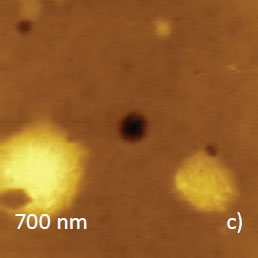
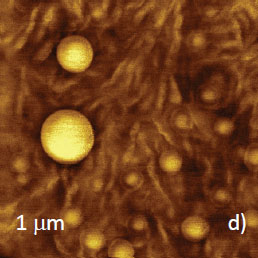
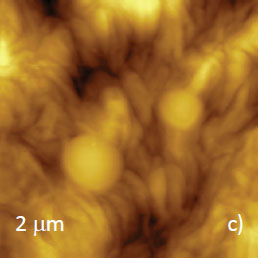
Surface locations, which are dominated by one of the components, were observed in film of PS/HDPE blend. In first case, a central sub-micron domain and three small nano-scale domains of HDPE are inserted into PS matrix, Figures 7a-b. This assignment is justified by the analysis of the elastic modulus map, which shows a softer nature of the domains. Lamellar structures, which are distinguished inside the central domain in the map, confirm this conclusion.
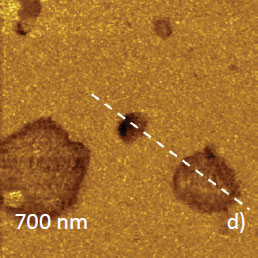
The morphology of the other surface location of PS/HDPE blend is different, Figures 7c-d. A couple of rigid domains, most likely, made of PS are lying on the array of lamellar structures of HDPE. High-crystallinity of this PE is reflected by well-developed and closely packed 2D lamellae, which exhibit predominantly the edge-on orientation. In contrast to other PS/PE blends, there are few traces of amorphous polymer in PE component of PS/HDPE material.
Height
Elastic Modulus
Height
Elastic Modulus
The PS/PE blends, which were examined above, have their specific heterogeneity due to semi-crystalline nature of one component. Morphology of such three-component materials has been best elucidated with the elastic modulus mapping in HybriD ModeTM.
RECOGNIZING COMPONENTS OF PS/PVAC BLEND
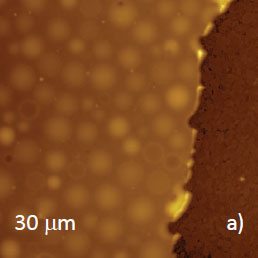
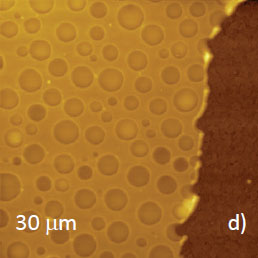
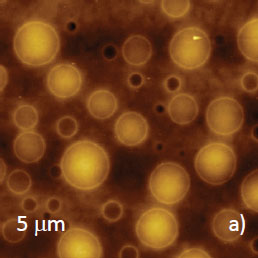
Microphase separation of the components in film of immiscible PS/PVAC blend leads to surface circular structures embedded in a relatively flat matrix. This morphology is seen on the left side of the height image in Figure 8a. A scratch on right side was made with a sharp wooden stick to open the glass substrate. By profiling the polymer/substrate step we determined that the film is ~80 nm thick. The domains, wich are few microns in diameter, are different in height, with most being raised up to 15 nm
above the matrix. In contrast to PS/PE blends, both components of this blend are amorphous. Therefore, they lack the lamellar structures that help polymer identification. However, there are other approaches for compositional imaging, which besides AFM/Raman chemical identification include studies at different temperatures and in various environments. The latter applications make use of differences of the components’ Tg and the fact that PS is hydrophobic and PVAC is hydrophilic material. Furthermore, PVAC is
enriched in polar groups and this explains different static dielectric permittivity of the blend components (2–3 for PS and 7 for PVAC) as well as their dissimilar dipole moments (0.3 D for PS; 2.1 D for PVAC). The differences in the electric properties of the polymers make possible the use of AFM‑based electric modes for their recognition in blends.
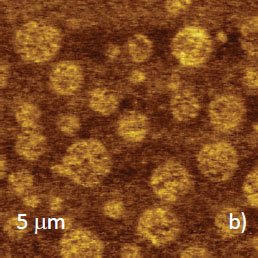
In HybriD ModeTM study of PS/PVAC blend, in addition to the height image and elastic modulus map (Figures 8a-b), we have recorded the phase image, Figure 8c. The latter represents an offset between the probe and sample periodical motions, which relate to the tip-sample force and sample deformation. At room temperature the map contrast reflects mostly the difference between the elastic modulus of the substrate and the blend film. These locations also exhibit a slightly diverse phase contrast. As the sample temperature was raised above Tg of PVAC, the height image and elastic modulus map showed that circular domains became much softer than the matrix (Figures 8d-e). These domains also exhibit a phase change compared to the surroundings, Figure 8f.
Height
Elastic Modulus
Height
Elastic Modulus
Elastic Modulus
Elastic Modulus
The findings indicate that the domains are made of PVAC – the polymer that softens above 40 0C. The matrix, therefore, can be assigned to PS. The phase change might be qualitatively related to transition of PVAC from glassy to viscoelastic state but the similarity between this effect and material viscoelastic behavior is limited. In contrast to dynamic mechanical measurements of macroscopic polymer sample, the stress and strain in AFM experiments are not described by harmonic functions.
The differences between the components of PS/PVAC blend at room temperature become obvious when the film is immersed into water.
Height
Map of PS
Map of LDPE (2800‑2990 cm‑1) band
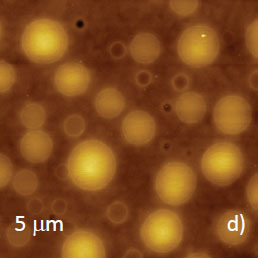
One can expect that in water hydrophilic polymer swells and changes its volume and mechanical properties. This is confirmed by the HybriD ModeTM data obtained on PS/PVAC film in water, Figures 9a-c. The shapes of circular domains have changed, and small depressed locations were noticed inside these domains, Figure 9a. The water-induced changes of the local elastic modulus and phase were more drastic. Softness of the circular domains and their phase contrast in water are similar to those observed in air at high temperature. In other words, water plays a role of plasticizer, which lowers effective Tg of hydrophilic PVAC.
The final confirmation of the assignment of the circular domains to PVAC and matrix to PS was obtained in AFM/Raman study. The maps of intensities of Raman scattering bands specific to the components, which were recorded together with height image, are presented in Figures 10a-c. The spatial resolution of Raman maps is inferior to the resolution observed in the frequency, phase images and in elastic modulus map. However, the chemically-specific information provided by this technique is unique. We are expecting the improvements of spatial resolution and further progress of this fast developing method and its counterpart – AFM/IR technique.
Height
Map of PVAC (2920‑3010 cm‑1) band
Map of PS (985‑1025 cm‑1) band
PS/PVAC blend is also a valuable sample for compositional imaging with AFM-based electric methods. The height, surface potential and dC/dZ data, which were obtained on this film in single-pass Kelvin Probe Force Microscopy (KPFM)at two temperatures, are shown in Figures 11a‑f. With temperature increase the topography features in height image (Figure 11d) became less pronounced. The overall corrugations and interfaces between the circular domains and the matrix have smoothened. The surface potential contrast between the domains and surrounding has been strong at room temperature and remains practically the same at temperature higher than Tg of PVAC, (Figures 11b, e). The behavior of dC/dZ signal (Figures 11c, f) was quite different and the circular domains became well pronounced in the map recorded at high temperature.
These changes reflect the onset of macromolecular motions when temperature is raised above Tg. This transition from glassy to viscoelastic state is also responsible for the softening and phase change of PVAC domains observed with HybriD ModeTM. Furthermore, the dC/dZ response is directly related to polymer dielectric permittivity, and the latter can be calculated from the dC/dZ data [7]. The presented results we obtained at 2ωe where ωe=3 kHz (the excitation frequency of the electrostatic force). Such studies should be extended to a broad frequency range, and this is direct approach towards dielectric spectroscopy at nanometer scale.
Height
Height
Elastic Modulus
Height
Height
Height
Figures 11a-f. The height, surface potential and dC/dZ data in (a)-(c) and (d)-(f) were obtained on a film of PS/PVAC blend at 27 °C and 75 °C, respectively.
EXPLORING MORPHOLOGY OF BITUMEN
Bitumen is a heavy component of oil and this material is applied for construction of automobile roads, and as a roofing component. Being a natural compound it has complex composition with variety of chemical constituents. Several classes of chemicals were identified in bitumen, and wax and asphaltene being the most common in species collected worldwide. Finding a correlation between bitumen composition/morphology and its technological properties is a serious task, and AFM was brought into a pool of characterization techniques focusing on this problem.
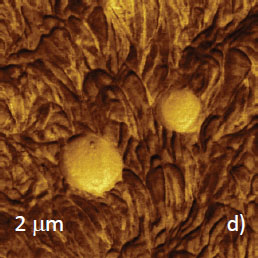
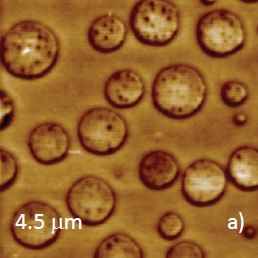
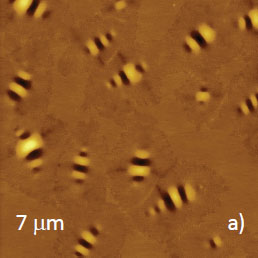
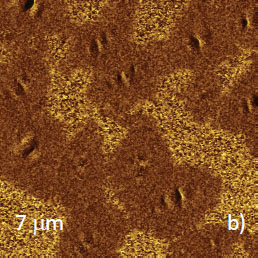
In first AFM applications to bitumen it was surprising to discover specific surface features with “bees”- like appearance [8].
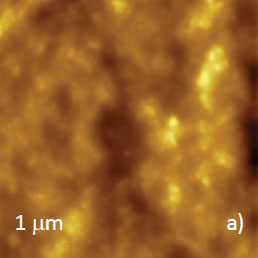
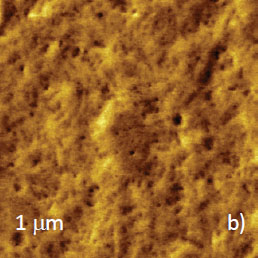
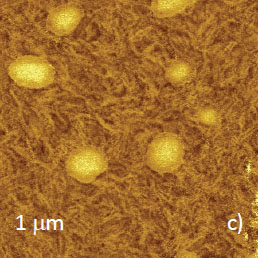
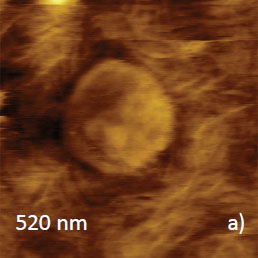
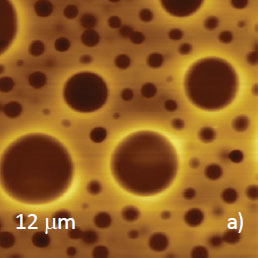
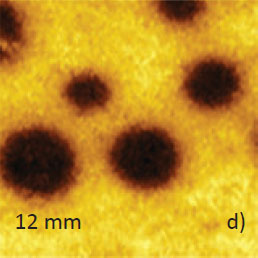
These extended shapes with lateral dimensions of several microns in length and vertical corrugations of up to 200 nm are shown in Figures 12a‑b. The “bees” are more common for surfaces of relatively thick adsorbates, and differently shaped structures are found in thin layers with thickness below 0.5 micron, Figures 12c-d.
Analysis of bitumen surface has revealed that the ‘bees’-containing domains alternate with the “bees”-free areas that are dissimilar in some properties. This composition is best observed in frequency image with a pronounced contrast in Figure 12b.
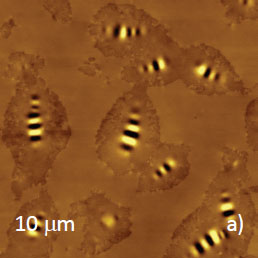
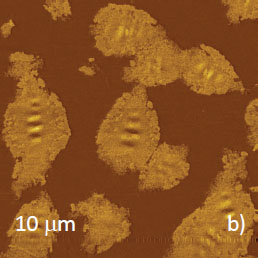
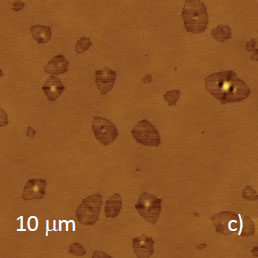
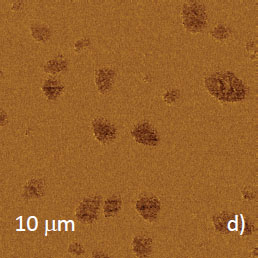
Figures 12a-d. (a)-(b) Height and frequency images, which were obtained on thick bitumen layer in AM-FI mode. (c)-(d) Height and phase images of thin bitumen layer in AM-PI mode
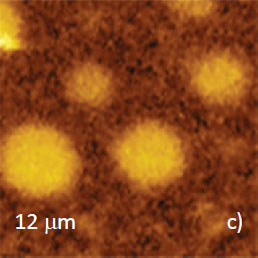
There are several hypotheses of the “bees” origin. We are in favor of the explanations that these structures represent this stressed surface state frozen on cooling from high temperature to room temperature. Discussions about the phase separation in bitumen due to the presence of component, which is enriched in polar groups, have motivated us to use the AFM-based electric modes for compositional analysis of bitumen. Indeed, the single-pass KPFM study revealed that the “bees”-containing domains exhibit a darker dC/dZ contrast compared to others.
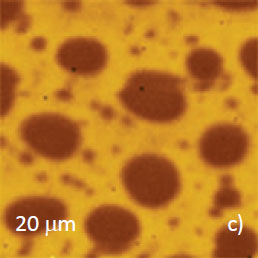
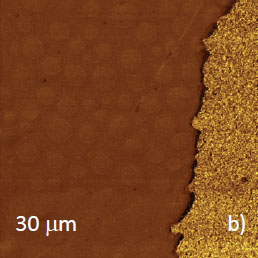
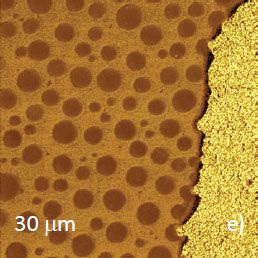
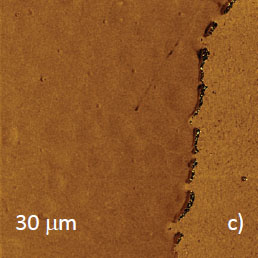
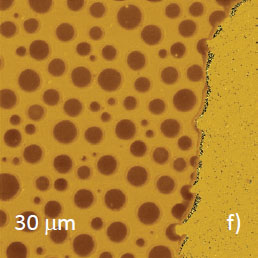
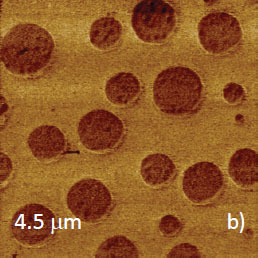
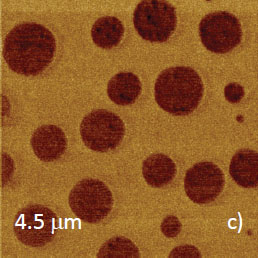
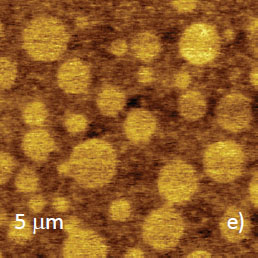
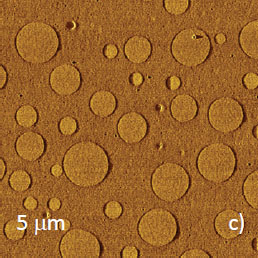
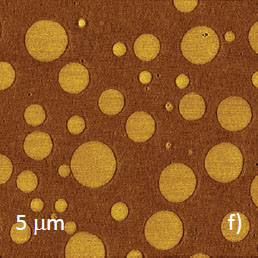
Such binary morphology has been observed in thick and thin bitumen adsorbates, in which the ratio of these components is different. In thick adsorbates the bees-containing domains occupy a half of the surface area (Figure 13a), and in thin layers these domains present the minor component (Figure 13b).
The dC/dZ contrast of the bees-containing domains suggests that they are enriched in wax material and asphaltene dominates in other areas [9].
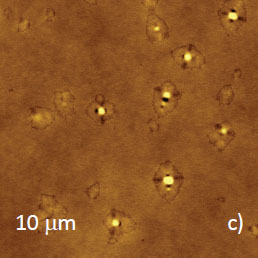
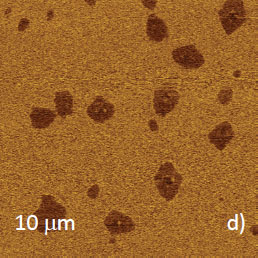
Figures 13a-d. Height image and dC/dZ maps in (a)-(b) and (c)-(d) were obtained, respectively, on thick and thin layer of bitumen
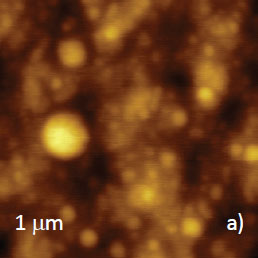
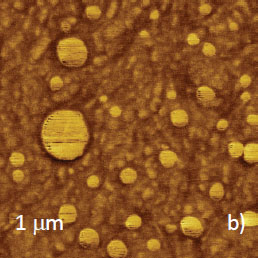
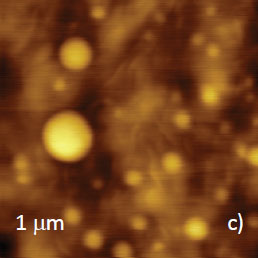
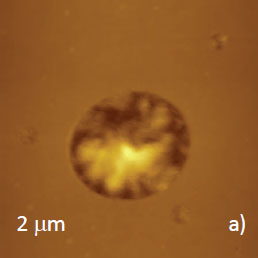
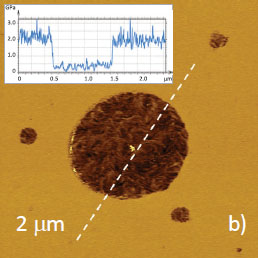
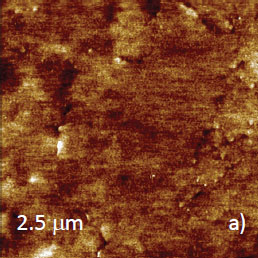
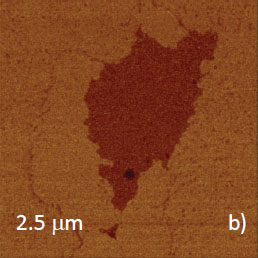
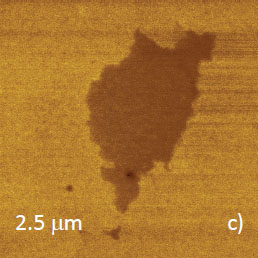
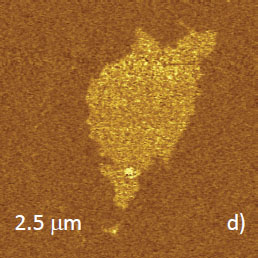
We are completing the description of compositional imaging with the example of the concert study of a surface location where the asphaltene domain is surrounding by wax material. The area was examined in four AFM modes as shown in Figure 14a-d.
Height image, which was recorded in FM mode in pure attractive force operation, most correctly reproduces flat surface topography.
When this area was examined in AM‑PI mode, the phase image reveals a central domain, Figure 14b. This domain is much softer than its surrounding as seen from the elastic modulus map recorded in HybriD ModeTM, Figure 14c. Furthermore, the dC/dZ map, which was obtained in single-pass electric study, shows that this domain is enriched in asphaltene. This is the illustration of comprehensive compositional imaging of the heterogeneous bitumen sample in AFM.
CONCLUSIONS
Expanding AFM techniques, in which different local properties of materials can be examined in qualitative and quantitative ways, are continuously enhancing the capabilities of this method for compositional mapping of different components of complex materials. We have demonstrating such applications with several examples.
There is still a room for further improvements after measurements of local viscoelastic properties and combined AFM/IR studies will became the routine procedures. The remaining challenges are the examination of nanoscale features, such as interface regions, and characterization of sub-surface morphology.
REFERENCES
[1] G. Binnig, C. Quate, and Ch. Gerber, Phys. Rev. Lett. 1986, 56, 930.
[2] N. A. Burnham and R. J. Colton, J. Vac. Sci. Technol. A 1989, 7, 2906.
[3] Y. Martin, D. A. Abraham, and H. K. Wickramasinghe, Appl. Phys. Lett. 1988, 52, 1103.
[4] S. Magonov and J. Alexander, Beilstein Journal of Nanotechnology 2011, 2, 15.
[5] S. Belikov, J. Alexander, C. Wall and S. Magonov, MRS Proceedings 2013, 1527, mrsf 12-1527-uu 02-04.
[6] S. Magonov et al. NT-MDT Application Note 90, 2015.
[7] S. Belikov, J. Alexander, S. Magonov, and I. Yermolenko, Amer. Control Conference 2012, 3228.
[8] L. Loeber et al J. Microsc. 1996, 182, 32.
[9] S. Magonov et al. J. Microsc. 2016, submitted.