


Investigation of Interactions Between Biotin and Streptavidin Molecules by Force Curve Spectroscopy
Application Note 076 (pdf 380 Kb)
INTRODUCTION
Scanning probe microscopy proves itself as a powerful tool not only for surface imaging but also for studying different forces acting between particles [1, 2]. For this purpose a force curve spectroscopy can be used. This technique is based on probe’s deflection registration as the cantilever either approaches to the surface or retracts from it [3]. One of the main applications of this technique for biology is possibility to study intermolecular forces, such as ligand-receptor interaction, antibody-antigen interaction [4]. In this paper biotin and streptavidin interaction was studied.
PREPARATIONS
On a freshly cleaved mica substrate a drop of streptavidin (diluted in phosphate-buffered saline to concentration of 50 мg/ml) was deposited. The incubation period lasted 20 minutes. After that the sample was rinsed by buffer solution in order to remove unbounded molecules. Prepared this way the streptavidin covers the substrate completely and allows to run force measurements without prior imaging of the surface. A triangular silicon-nitride probe modified with a biotin terminated polyethylene glycol (PEG) linker (probe CT_PEG_BIO series from “Novascan Technologies, Inc”) was used for the experiment. This modification gives the biotin molecule a higher mobility and raises its chances to be bound to the streptavidin molecule.
MEASUREMENTS
The experimental setup was as follows:
- Scanning Probe Microscope “SOLVER Pro”, scanning by sample configuration.
- Open liquid cell with buffer solution
- 3 um scanner
Landing was done in the contact mode. The operating point has been chosen to minimize an exposure to the sample. After landing force curves were taken in different points. At each point about 10-50 curves were measured. A scanner movement range was 80 nm in vertical direction, time for taking each curve - 1 sec. Therefore an average scanner velocity was 160 nm/s. All data were collected by using the same probe. Totally about 500 curves were taken for several hours. 367 curves were treated and analyzed. For all calculations the value of force constant 0.03 N/m was used.
RESULTS
Preliminary comments
All conclusions in the force spectroscopy about the nature of interactions between a probe and a sample might be done based on analysis of the shape of adhesion part on the backward branch. In our case it’s necessary to distinguish a case of specific binding of molecules among others and to derive a value of interaction force from them.
In the experiment the sample covered by continuous layer of streptavidin and the probe with molecules of polyethylene glycol doped by biotin at the end of the tip were used. Low concentration of the molecules at the end of the tip provided a formation of single molecule interaction between biotin and streptavidin. On the other hand large area of the tip is free from biotin and it leaves a good opportunity for a direct interaction between the tip and the sample’s surface. It generally leads to three possible cases of binding: specific binding of biotin and streptavidin (Fig. 1a), non-specific binding of the tip and the sample (Fig. 1b), or the combination of two first cases (Fig. 1c).
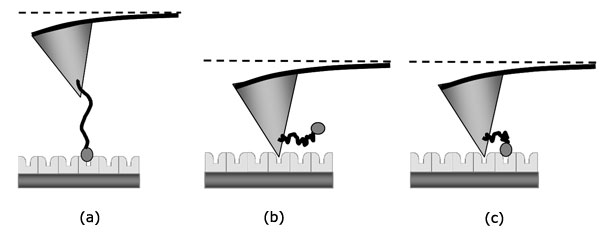
Fig 1. Scheme of possible types of binding: (а) Specific binding between biotin-streptavidin molecules only, (b) Non-specific binding between the tip and the surface, (c) Simultaneous binding between the tip, the biotin molecule and the surface
When the tip binds to the sample directly then on the backward way the tip’s deflection will linearly increase and it will be equal to the scanner’s displacement. The slope of the force curve at the adhesion part of the graph will be equal to the same at the contact part of the graph (blue solid line on Fig. 2). When the specific binding takes place the tip is bound to the sample through the polyethylene glycol molecule (PEG), which may change its length. Retracting from the surface the scanner will make the tip moving. But in this case the tip will not move as previously. Its deflection will have a delay from the scanner’s displacement due to stretching of the PEG. Nonlinear dependence of length change of the PEG molecule on its load [5] will provide a typical nonlinear shape of the force curve at adhesion part (a dashed blue line on Fig. 2). It greatly lightens a correct identification of specific binding cases and increases reliability of results.
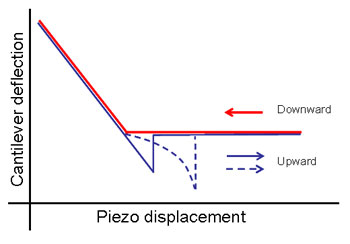
Fig 2. Schematic representation of force curve. On the blue branch a dashed line represents a specific binding through the PEG molecule, and solid line – direct probe’s adhesion
Force Spectroscopy
During the experiment a few hundred curves were obtained. The shape of the curves was very different. Then a decision to separate them into three general groups was made. It based on the fact of presence or absence of specific binding:
1) The specific binding is present
2) The specific binding is absent
3) Other cases. More detailed explanation of each group may be found below.
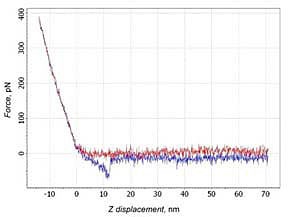
1. Specific binding is present
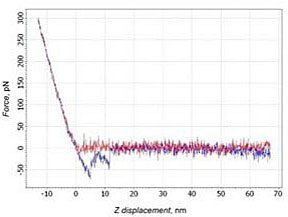
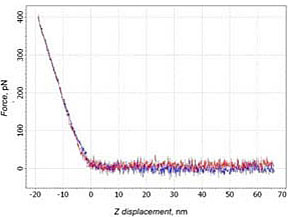
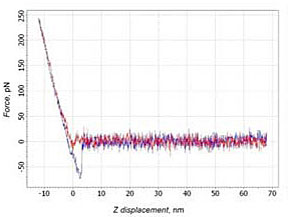
14% of force curves with a typical shape of the adhesion part for PEG molecule stretching were observed. The force depended nonlinearly on the scanner’s displacement (Fig. 3а). Such curves were identified as a case of the specific binding. About 20% of curves show not only the specific binding, but also a direct interaction between the tip and the sample (Fig. 3b). In this case two adhesion peaks were observed. The slope of the curve before the first peak corresponds to the slope at the contact part. This means that the peak may be considered as nonspecific adhesion of the tip to the surface. After the tip disengages from the surface a typical behavior of PEG stretching can be observed.
a)
b)
2. Specific binding is absent
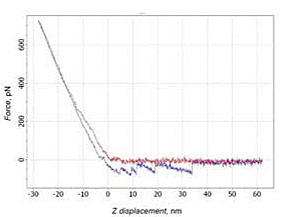
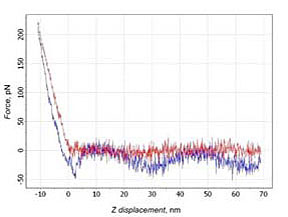
In 23% cases the forward and backward branches matched one another (Fig. 4a), i.e. the negative deflection was not seen. This means absence any interactions between molecules. Also in 24% cases on the backward branch a small area of adhesion could be recognized. But this picture is typical for the case when the tip’s sticking to the surface. Therefore, it cannot be treated as a case of specific binding – the slope at adhesion part corresponds to the slope at the contact part (Fig. 4b).
a)
b)
3. Other cases
16 % of curves corresponded to the cases with interaction on distances, which exceeded the length of PEG molecule (about 20 nm). 4% were unusable for analysis due to cantilever’s oscillations (Fig. 5).
a)
b)
Interaction Force
The breaking force measurements were based on 163 curves when the specific binding took place (Fig. 6). According to the histogram the value of unbinding force were found 43 ± 15 pN. This matches data obtained by similar method [6].
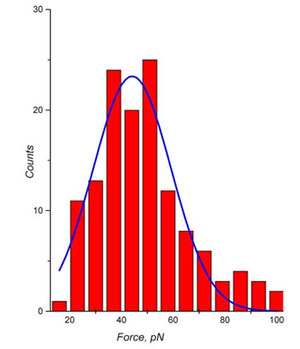
Fig 6. Distribution of biotin-streptavidin bond breakage force
CONCLUSION
The work demonstrates on the biotin-streptavidin case abilities of SPM to be used for investigations of single molecule interactions. With using this technique some specific cases of binding were found. The magnitude of bond breakage force was quantitatively measured. One third of total number of curves represented case of specific binding. This fact shows a high sensitivity of the technique.
REFERENCES
- Heinz, W. F., Hoh, J. H., Tibteh 17, 143-147 (1999).
- Capella, B., Dietler, G., Surface Science Reports 34 (1999) 1-104
- http://www.ntmdt.com/SPM-Techniques/Principles/
- Allen, S. et al., Trends Biotechnol. (1997) 15, 101–105
- Kienberger, F., Pastushenko, V. Ph., Kada, G., Gruber, H. J., Riener, C., Schindler, H., and Hinterdorfer, P., Single Molecules 1 (2000) 2, 123-128
- Riener, C. K. et al, Analytica Chimica Acta 479 (2003) 59–75