


AFM-Raman Characterization of Pharmaceutical Tablets
Application Note 092 (pdf 1.9 Mb)
Sergey Shashkov1,2 and Pavel Dorozhkin1,
1 NT-MDT Co., Zelenograd, Russia
2 QuantumDesign Japan, Tokyo
Compound Distribution Studies in Pharmaceutical Tablets by Integrated AFM-Raman Instrument.
INTRODUCTION
Raman microscopy is a widely used technique in pharmaceutical industry [1]. It allows identifying and rapidly characterizing cheрmical compounds, functional groups, molecular conformers, and authenticating various drugs.
It is also useful in revealing the presence of impurities and structural disorder in materials, studying stress distributions, and temperature effects. Integration of Raman spectroscopy with Atomic Force Microscopy (AFM) opens a wide range of new capabilities in imaging and characterizing pharmaceutical products. For example, AFM topographic imaging provides information on the size of grains, their shape, orientation and distribution. In addition, advanced AFM techniques also allow high resolution imaging of various physical properties of micro-scale objects: local hardness, friction coefficient, electrical conductivity, surface potential and many others.
In this application note an integrated AFM-Raman instrument is used for a comprehensive study of a representative pharmaceutical tablet to demonstrate the capabilities of the technique.
The working principle of the AFM-Raman setup is shown in Fig. 1a. An atomic force microscope is integrated with a high resolution objective lens in a top-illumination geometry.
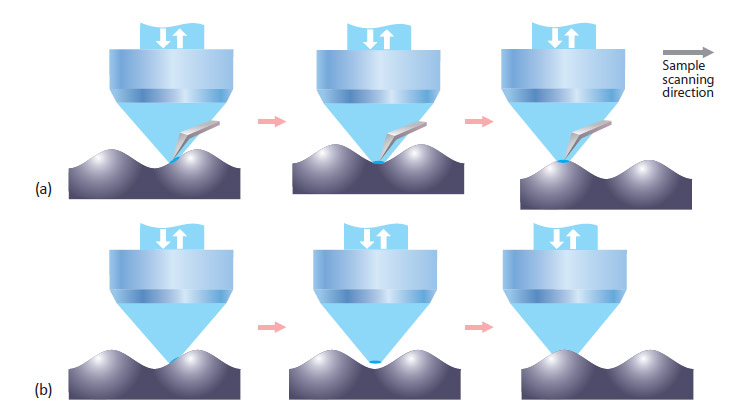
The objective is connected to a confocal Raman/fluorescence microscope. The optical part of the setup is used to focus the excitation laser to a very small spot at the apex of the AFM cantilever and to collect the optical signal from a local area on the sample in the confocal regime. Raman scattering, fluorescence, Rayleigh scattering and other optical signals can be measured. Cantilevers with an “elephant-trunk” shape are used to avoid obstruction of laser light by the cantilever. While the sample is scanned (in X,Y&Z directions), AFM and optical images are obtained simultaneously from exactly the same sample area. Alternatively, Raman and AFM images (from the same sample area) can be obtained independently. In this case, the Raman image is obtained in a “standard” configuration without the presence of an AFM cantilever (Fig. 1b). More details of the AFM-Raman instrument operation can be found in [2].
One of the important advantages of simultaneous AFM-Raman mapping is the possibility to image very rough surfaces which is important, for example, when pharmaceutical tablets are studied. The connoted “focus track” capability of the integrated AFM-Raman instrument is demonstrated in Fig. 1a-b. When a rough sample is scanned in a standard mapping regime (X&Y sample movement only), the surface of the sample comes in and out of focus of the objective while sample is moving (Fig. 1b). This results artifacts in the confocal Raman imaging that may lead to erroneous interpretation of the data. For example, observed variations of Raman signal intensity can be due only to the sample topography (surface coming in and out of focus); not to changes in the chemical composition of the surface. In the “focus track” regime the AFM cantilever is placed under the objective (Fig. 1a) and the excitation laser is focused on the apex of the cantilever (within the optical resolution of the lens). When the sample is scanned, the AFM feedback mechanism adjusts the sample height to keep it in controlled contact with the AFM cantilever.
This guaranties that surface of the sample always stays precisely in the laser spot focus. Thus, the optical signal is always obtained exactly from the sample surface, independent of the sample roughness. Therefore, when focus track is used, all variations of the Raman signal are from the sample composition and not from topographic roughness.
As a pharmaceutical sample, an ANADIN EXTRA tablet (Pfizer Consumer Healthcare Ltd) was selected for characterization by the AFM-Raman technique. ANADIN is an analgesic medication, consisting of three active components: Aspirin, Paracetamol, and Caffeine. Each tablet contains approximately 300 mg of Aspirin, 200 mg of Paracetamol and 45 mg of Caffeine. These active ingredients should be combined uniformly to produce a quality tablet. Homogeneous distribution of the components will improve compression characteristics of the tablets, hardness, robustness, lifetime, biocompatibility, assimilability, reduce segregation and defects.
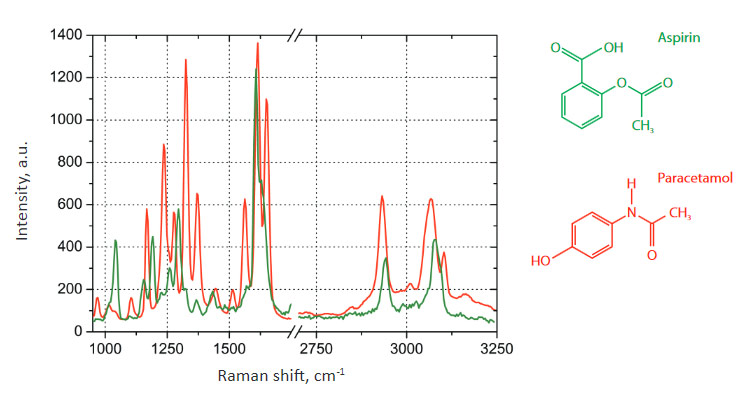
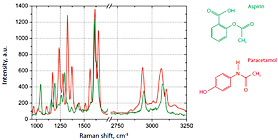
Fig. 2. Raman spectra on the ANADIN Tablet: Aspirin (green color), Paracetamol (red color)
MEASURING THE DISTRIBUTION OF THE INGREDIENTS IN THE TABLET IS IMPORTANT FOR MONITORING THE MANUFACTURING PROCESS AND FOR IMPURITY TESTING
The tablet was prepared for our measurements by slicing it in half with a steel razor blade so that a flat surface was produced. A “fresh” clean razor blade was used to avoid sample contamination.
The sample exhibits two characteristic types of Raman spectra at different places on the tablet, shown in Fig. 2. These spectra correspond to the two main components of ANADIN: Aspirin and Paracetamol. We did not examine in detail the distribution of Caffeine or the other ingredients of ANADIN.
Caffeine is widely spread across the tablet, but present only in small discrete areas. Each ingredient will produce a Raman spectral component with a relative intensity proportional to the ingredient’s local concentration.
Spectral positions of Raman peaks are different for the different tablet components due to the chemical structure of compounds.
The main peaks of Paracetamol can be identified as the C=O stretch at 1651 cm-1, NH deformation mode at 1612 cm-1, HN-C=O bend-stretch at 1559 cm-1. Other Raman modes in the 1370 to 1166 cm-1 spectral region are due to both the N-H bending and C-H deformation vibrations [3].
Raman spectra of aspirin have the characteristic bands at 1606 and 1622 cm-1 (shoulder), which can be assigned to the symmetric aromatic ring CC-stretching vibration and CO-stretching vibration of the carboxyl group, respectively. There are several additional bands in the spectral range below 1500 cm-1. The strongest features are at 1296 and 1045 cm-1. The first one is attributed to the OH-bending vibration.
Around 3000 cm-1, several CH-streching vibrations on different carbons are observed [3].
Characteristic Raman spectra of Aspirin and Paracetamol were used to map the distribution of chemical compounds in the ANADIN tablet. Focus Track must be used on these types of samples to avoid confocal signal variations due to profile irregularities which are comparable to the axial resolution of the Raman microscope (sample roughness measured by the AFM is about 2 μm).
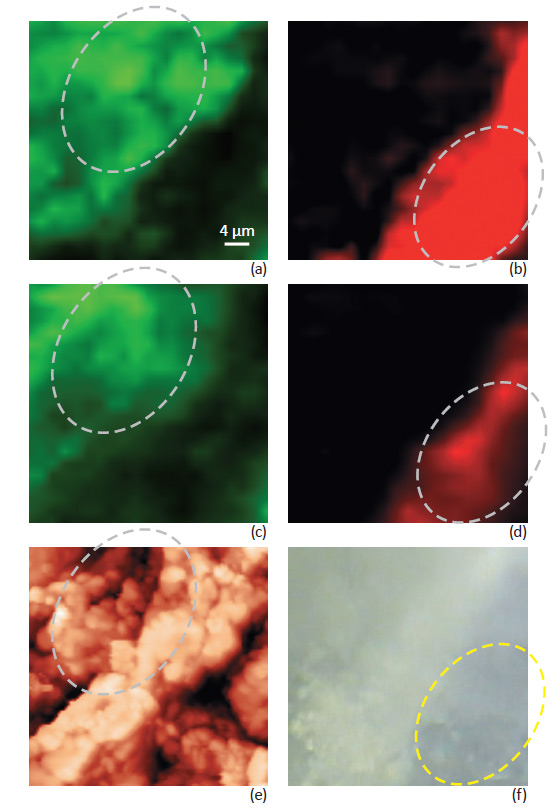
The difference between confocal Raman maps of the tablet taken with and without Focus Track is illustrated in Fig. 3 where the chemical distribution of Aspirin and Paracetamol is presented. Fig. 3a-b show data measured with Focus Track feature. Fig. 3c-d show conventional Raman maps taken from the same sample area without using Focus Track.
Data measured without Focus Track represents variation of Raman signal intensity due to both variations in chemical composition and sample height. The combination of these two different contributions is not possible to separate. Data measured with Focus Track feature reflects a more accurate mapping of the sample composition. For example, measurements with Focus Track show relatively uniform Paracetamol distribution in the areas marked on Fig. 3b. Measurements from the same area taken without Focus Track (Fig.
3d) show “non-uniform” Paracetamol distribution – an artifact due to the variations of the sample height in this area, see Fig. 3e. The aspirin distribution also shows strong differences, especially in the selected areas, Fig. 3a-c, when measured with and without Focus Track.
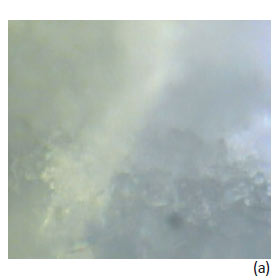
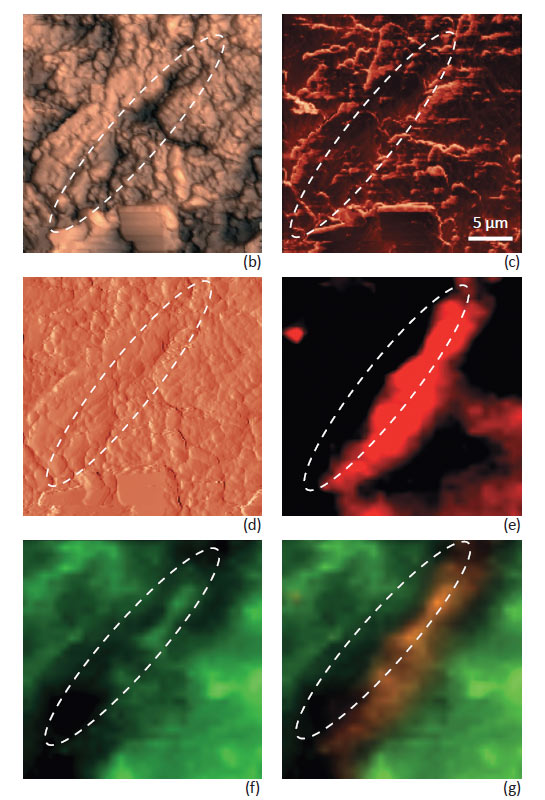
Fig. 4 shows Raman maps taken with Focus Track together with corresponding AFM images. The Raman maps reveal a more accurate spatial distribution of the compounds of the ANADIN tablet – free from topography artifacts. A phase separation of Aspirin and Paracetamol compounds was observed. Distribution of the Anadin tablet components on the micro level is in accordance with their percentage composition. The amount of Aspirin in the ANADIN tablet is larger, than the amount of Paracetamol. An optical image of the tablet (Fig. 4a) shows many microcrystalline grains – dark and bright areas on the tablet. AFM topography images can provide much deeper insight into the grain structure on the surface (Fig. 4b-d).
Individual grains (not seen on optical images) are perfectly visualized. The smallest particle size of different components can be estimated as 1–5 μm.
Phase and magnitude of cantilever oscillation recorded during scanning provide complimentary information to the AFM topography. Phase imaging shows a clear contrast when there is a detectable variation of interaction forces between the cantilever and the surface. Thus, phase images highlight grain edges and are not affected by large-scale height differences, providing clearer observation of the sample fine features (Fig. 4c). Magnitude (cantilever oscillation amplitude signal) provides additional contrast (Fig. 4d); grain edges are also clearly observed because of instantaneous, sharp, changes in the sample height.
A clear correlation between AFM and Raman images is observed. Characteristic domains on the tablet with high Paracetamol concentrations seen in the Raman images (marked with ovals on Fig. 4) has corresponding specific features the AFM images.
CONCLUSION
Raman microscopy integrated with Atomic Force Microscopy is a powerful analytical tool for pharmaceutical applications.
AFM images of tablets provide information about sample topography, grain structure, orientation, and grain boundaries. Raman maps provide distribution of chemical components without the need for complex sample preparation.
The Focus Track feature of the NTEGRA Spectra AFM-Raman instrument keeps the sample surface exactly in laser focus even for very rough surfaces, due to the AFM feedback. This allows Raman imaging of rough surfaces without any artifacts coming from
sample height variations.
In this study, the distribution of Aspirin and
Paracetamol components within the ANADIN tablet
was studied with high spatial resolution and free of
any artifacts due to sample roughness. Correlation
between sample chemical composition and AFM
images is observed.
ACKNOWLEDGEMENT
NT-MDT is grateful to Renishaw K.K. (Tokyo) for providing Raman inVia Raman spectrometer for the integrated AFM-Raman instrument used in this work.
REFERENCES
[1] Williams AC. Handbook of Raman Spectroscopy:
from the Research Laboratory to the Process Line.
Practical Spectroscopy Series, vol. 28, Lewis IR, Howell
G, Edwards M (eds). Marcel Dekker: New York,
2001; 575.
[2] http://www.ntmdt.com/device/ntegra-spectra
[3] Pestaner JP, Mullick FG, Centeno IA. Characterizationof
acetaminophen: Molecular microanalysis with
Raman microprobe spectroscopy. J Forensic Sci 1996;
41(6): 1060‑1063.