


Expanding Atomic Force Microscopy with HybriD Mode Imaging
Application Note 087(pdf 6.2 Mb)
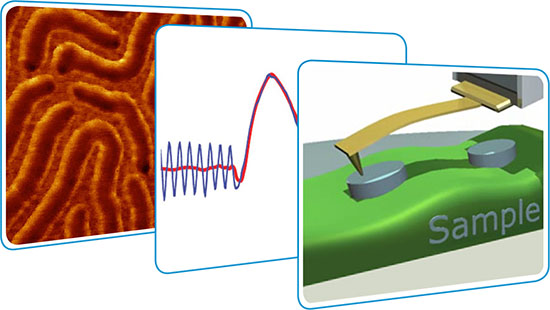
- Enhanced visualization of nanoscale structures - one of remarkable features of the HybriD Mode.
- High-resolution mapping of local adhesion and stiffness in the HybriD Mode expands AFM compositional mapping of heterogeneous materials and transforms it into quantitative analysis of local mechanical properties.
- A combination of HybriD Mode with multi-frequency capabilities of the resonant AFM techniques is the basic of comprehensive material characterization at the nanoscale.
Sergei Magonov, NT-MDT Development Inc.
A family of atomic force microscopy techniques is enriched by an addition of the HybriD Mode, in which a cantilever deflection during oscillatory tip-sample force interactions is tracked with high sensitivity. Such operation, which becomes possible with an implementation of fast data acquisition and real-time signal processing, leads to new advanced applications. The recording of the deflection response in the different parts of the interaction cycle offers new capabilities for the feedback control and mapping of local mechanical and electromagnetic properties. The experimental data collected with the HybriD Mode on a variety of samples demonstrate the unique features of this mode and provide its rational comparison with the results of Amplitude Modulation technique, which is more broadly applied so far.
INTRODUCTION
Atomic force microscopy (AFM) has been established as the useful characterization tool for high-resolution surface imaging and examination of local materials properties. The detection of force interactions between the tip of a microfabricated probe and a sample surface is localized to the nanometer-scale that provides the unique sensitivity and spatial resolution of AFM measurements. At present, the technique has a family of operation modes and its capabilities are continuously improving with the development of more sensitive detection of force interactions, fast data acquisition electronics and implementation of multi-frequency measurements in the broad frequency range. Having a spectrum of operational modes expands the AFM capabilities for high-resolution surface profiling, visualization of surface structures and for exploring their mechanical and electromagnetic properties.
On the other hand, the optimal choice of mode and operational conditions, which provides a most relevant data regarding the sample property or features in question, might be a non-trivial task. Below we will introduce the HybriD (HD) Mode – an oscillatory non-resonant mode, in which the probe and the sample are brought into intermittent contact in the vertical direction and the induced probe deflection is employed for surface tracking feedback. In evaluation of the HD capabilities we will compare the mode with the well-known amplitude modulation (AM) mode [1, 2], in which the probe oscillates at its resonant frequency and the damping of the amplitude is employed for the surface profiling.
The basic idea of minimizing lateral probe-sample interactions through the intermittent contact was considered in the stylus profiler with vibrating probe in 1955 [3], and in jumping mode that has been suggested with analog and digital control for AFM in 1989 [4]. In a number of other oscillatory modes, including the AM mode, the probe or actuator is excited at its resonant frequency that leads to higher sensitivity. However, the amplitude, phase and frequency responses are required a dedicated mathematical treatment allowing their interpretation in terms of local mechanical properties. In HD Mode the sample and the probe interact at a frequency below the resonant frequencies of the piezo-driver and the probe, therefore the probe deflection level is more directly related to the tip-sample forces.
This circumstance allows for the surface profiling at a constant deflection similar to the contact mode but in a more gentle way due to minimized shearing forces. In addition, the probe deflection during the different parts of the oscillatory cycle in the HD mode reflects the action of long-distant tip-sample forces, adhesive and mechanical interactions and these responses can be presented simultaneously in the related maps with sample topography. The essential features of this mode and the instrumental developments, which enable its practical realization in NT-MDT Spectrum Instruments microscopes, will be described below. The practical value of HD mode will be illustrated by its applications to variety of samples. Particularly, the adhesion and stiffness mapping will be verified on binary materials compositions. A rational comparison of the data obtained with the HD and AM modes shows that the HD mode in concert with multi-frequency AM studies provides the grounds for the most advanced AFM analysis of materials.
INSTRUMENTAL PART
Recently, the capabilities of NT-MDT Spectrum Instruments microscopes are empowered by the electronic controller, which allows high-quality AFM operations with small deflection noise (~25 fm⁄√Hz), low-noise high voltage drive (noise < 1 mV/600 V) and multi-frequency measurements with five lock-in amplifiers. These improvements have allow the atomic-scale imaging of calcite and tetrathiafulvalene - tetracyanoquinodimethane crystals in AM mode [5], single-pass mapping of surface potential with the nanometer resolution [6] and multi-frequency studies of piezoresponse [7].
A new addition to the controller is a high-speed (20 MHz) data acquisition module, which allows a real-time collection of the probe deflection traces in the oscillatory cycles in the 0.5 – 10 kHz range in NEXT and NTEGRA microscopes. The unit allows fast data processing at 120 MHz that is essential for real-time treatment of incoming data. The added functionality is supported by software modules that are embedded into the continuously developing Nova software package.
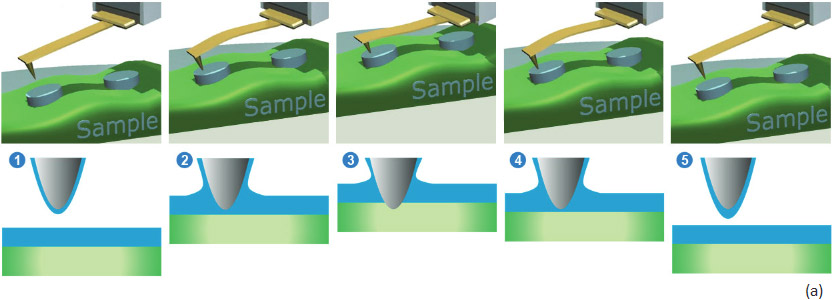
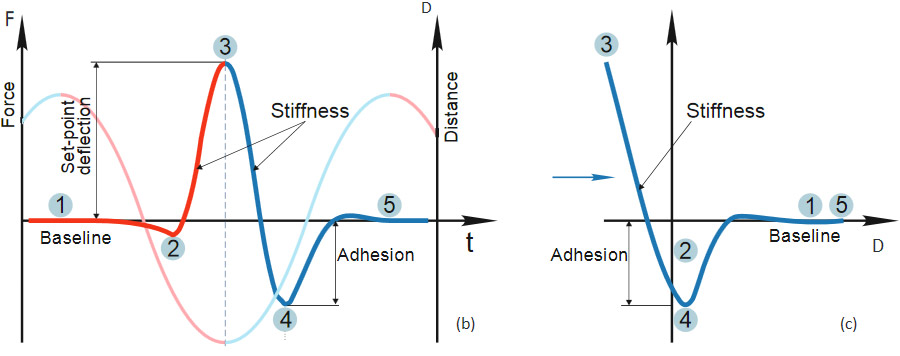
In the HD mode, the sample or the probe is driven into a vertical oscillation by a Z piezo-element at the frequency well below the resonances of the probe and the piezo-element. The HybriD Mode with the low-frequency oscillation of a sample is realized in NEXT and NTEGRA microscopes, whereas in Smena microscope the same mode is implemented using the low-frequency oscillation of the probe that is fixed to the piezo-scanner in this instrument. As the probe and the sample approach each other in every cycle the tip goes from non-touching to touching regime and the cantilever deflects in response to the tip-sample interactions to the operator-chosen level. This sequence of the events and with an idealized deflection profile of the probe in the single cycle of HD mode is illustrated in Figures 1a-b. As the probe-sample distance shrinks, the cantilever deflection first stays at the baseline level (point 1 in the deflection profile) and then it might bend down in response to adhesive or capillary forces (point 2). On further approach, when the repulsive tip-sample forces dominate, the bending reverses upwards until it reaches the set-point level (point 3) chosen for lateral scanning feedback. This is the turnaround Z-position of the cycle.
As the sample and the tip depart, the probe might experience strong adhesive interactions reflected by a well (point 4) in the deflection, before the probe fully detaches from the sample and the cantilever restores its baseline deflection (point 5).
The temporal deflection plot contains a wealth of useful information that can be detected, also mapped during lateral scanning and used for the extraction of quantitative local properties of the sample. For example, the baseline level might be influenced by long-distance electrostatic and magnetic forces that are sensed by probes with conducting or ferromagnetic coatings, respectively. The conducting probe can also detect the tip-sample current or local piezoresponse when the probe is in the touching part of the cycle. The attractive wells on the approach or retracting part of the plot can be employed for measurements of adhesion. The approaching and retracting slopes of the plots in the touching part of the cycle are related to the sample stiffness. The choice of the set-point deflection depends on the experiment goal; lower set-points are more suited for gentle imaging whereas higher set-points are in favor of nanomechanical mapping.
These are the well-known features of the temporal deflection plots and related deflection-versus-Z (DvZ) curves (Figure 1c), which have been used for a long time in contact mode studies [8, 9]. The DvZ or force curves in contact mode are practically made at the frequencies in the 0.1-10 Hz range, which substantially limits their applications. This hurdle is overcome in HD mode where fast data acquisition allows real-time collecting, analyzing and displaying the data recorded in the kHz frequency range. In addition, the deflection variations in different parts of the oscillatory cycle can be detected and processed independently in real-time.
Typically, in the NTEGRA and NEXT microscopes the sample is oscillated at 1.5 kHz (time of the cycle is 0.67 msec) with amplitude in the 50-100 nm range and the set-point probe deflection is chosen in the 1-20 nm range. The latter is equivalent to the overall repulsive force 0.2-20 nN range for probes with a cantilever length in the 60‑300 micron range and a stiffness in the 0.5 – 2 N/m range.
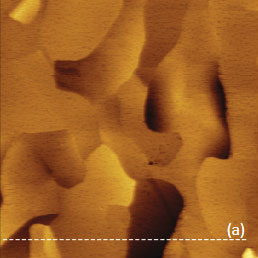
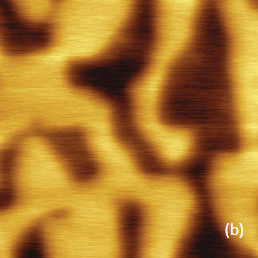
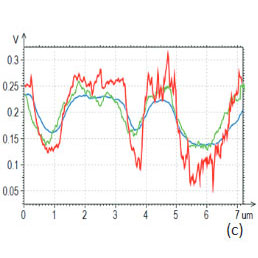
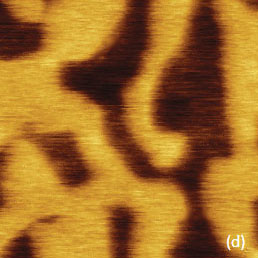
Some examples of the HD mode applications are given in Figures 2-4. The height, adhesion and stiffness images of a poly(diethyl siloxane) (PDES) layer on Si substrate are shown in Figures 2a-c. For comparison with the HD mode AM images of the same location on the PDES sample are shown in Figures 2d-e. This mesomorphic polymer, which is spread by rubbing on Si substrate, consists of stiffer lamellar aggregates embedded into soft amorphous material, and the morphology of PDES samples has been examined earlier with AM mode [10-11].
Typically, the AM images show the lamellar aggregates, which are best resolved in the phase images (Figure 2e), that are commonly used for compositional mapping of heterogeneous polymers [12]. In AM mode, contrary to the height image (Figure 2d), the contrast of the phase image differentiates the components of heterogeneous polymers. The interpretation of the phase contrast in terms of accurate mechanical properties of the sample is not developed.
This goal can be achieved with the HD mode as seen in the PDES maps of adhesion and stiffness, Figures 2b, c. The stronger adhesion is observed on the amorphous polymer surrounding the lamellar aggregates and the aggregates show higher stiffness in the related map. In other words, HD mode helps independently distinguishing the variations in adhesion and stiffness and these data can be further used for quantitative extraction of work of adhesion and elastic modulus of the materials. One can also notice that the contrast of the height image obtained in HD mode reveals the lamellar aggregates that are almost not visible in the height image recorded in AM mode. This observation raises a question about the actual levels of the tip-force in these modes, which will be considered below.
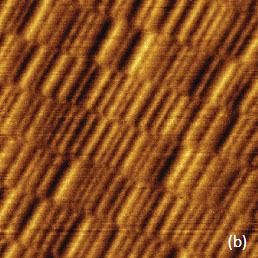
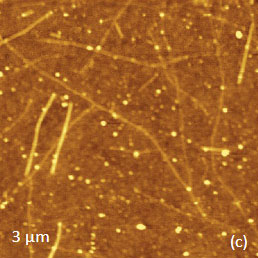
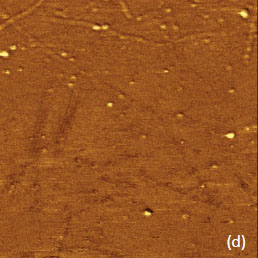
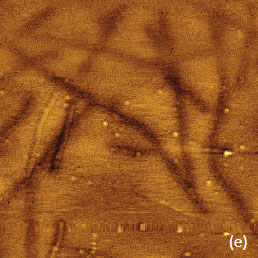
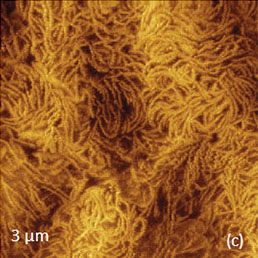
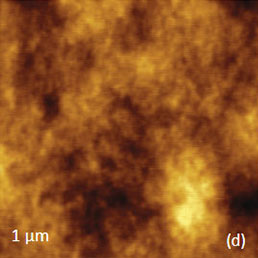
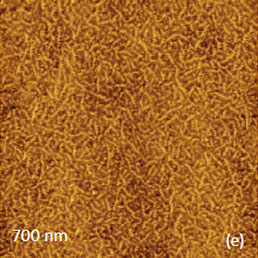
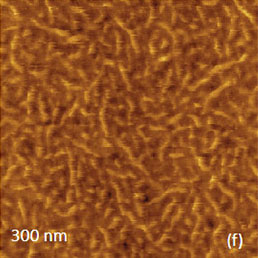
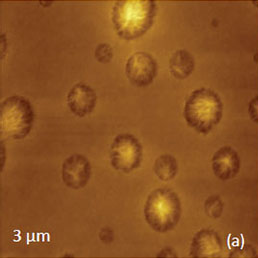
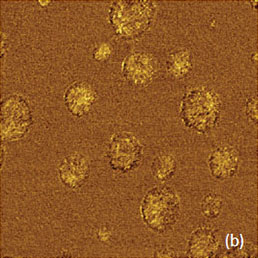
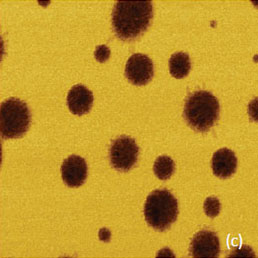
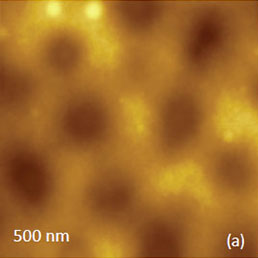
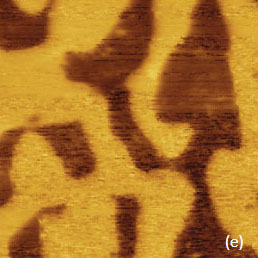
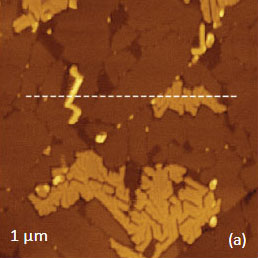
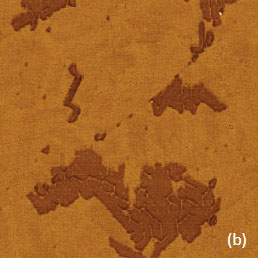
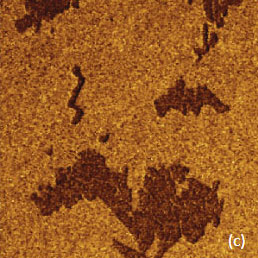
Studies of local electromagnetic properties in HD mode are illustrated in Figures 3-4. The AFM images of arrays of carbon nanotubes deposited on Si substrate are shown in Figures 3a-d. Tip-sample current variations were recorded simultaneously with the height, adhesion and stiffness images.
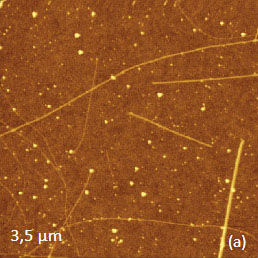
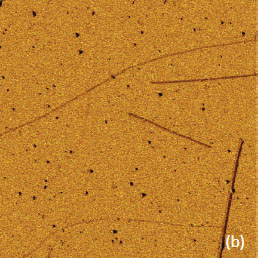
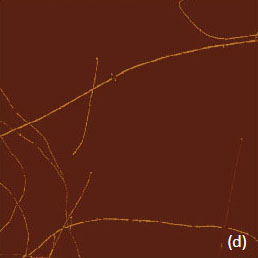
The local adhesion and stiffness contrasts reflect different nature of the surfaces of the nanotubes and the Si and also relative softness of these objects with respect to the substrate. The map in Figure 3d shows that the current flows only through a select number of nanotubes and, most likely, these contrast changes point out that nanotubes exhibit conducting and semiconducting behavior.
The current measurements were performed only in the touching part of the oscillatory cycle. In the non-touching part, the mechanical tip-sample interactions are negligible and the cantilever deflection is mostly subjected to the long-distant electrostatic and magnetic forces.
The contrast map reflecting the baseline changes echoes the magnetic structure of a hard disk sample, whereas the height image, which is based on the set-point deflection in the touching part of the cycle, shows the disk roughness, Figures 4a-b.
The sensitivity of the baseline in the HD mode to the electrostatic force is demonstrated in the images of carbon nanotubes in Figures 4c-e. Here the baseline contrast was enhanced by applying a bias voltage between the conducting probe and the sample. The contrast of the individual carbon nanotubes reflects variations in the electrostatic attractive force that primarily is related to the differences in their local surface potential.In practice, the temporal deflection plots can be more complicated than the idealized one due to a number of reasons. When experiments are performed at ambient conditions, surfaces of the probe and sample can be covered by adsorbates of different kinds. Therefore, some magnitude of oscillation amplitude might be required to detach the tip from a particular location. When the probe is soft, the break-free from the tip-sample adhesion might induce a probe excitation at the resonance close to the probe eigen frequency. Such probe ringing is shown in the deflection plot in Figure 5a. As the media between a probe and the sample becomes more dense (e.g. liquid) it can transmit the sample motion to the probe cantilever that will cause a periodic cantilever deflection in immediate vicinity of the sample and the related sine-like envelope in the deflection plot, Figure 5b.
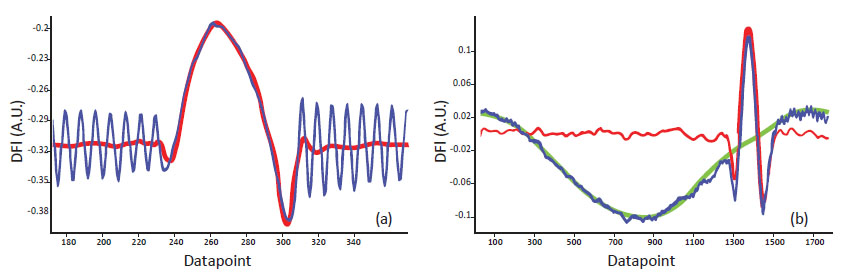
These are two kinds of the complications to be removed to make the temporal deflection plots ready for real-time processing in HD mode. For this purpose, the acquired deflection signal can be fast processed with a discrete wavelet transform (DWT) – the procedure, in which the incoming signal is filtered using basic wavelets and can be compressed for time-efficient in-line calculations. The choice of DWT is justified by the need for the time-frequency analysis of the deflection responses. The shown filtering of the plot with the ringing effect was performed using a Daubechies wavelet with 4 vanishing moments and level 3, Figure 5a. This is the default setting in our software; however, the wavelet choice can be adjusted by the user. The use of the Daubechies wavelet with 4 vanishing moments and level 8 helps to remove the sine-like overlay, Figure 5b. These real-time filtering procedures make the HD mode studies possible in variety of conditions and for a broad range of samples.
TIP-SAMPLE FORCES IN AMPLITUDE MODULATION AND HYBRID MODES
Tip-sample forces are the essence of AFM and their control is invaluable for high-resolution imaging of materials’ surfaces and probing of their properties. A low force and a small tip-sample interaction is needed to avoid undesirable tip and sample damage and for facilitating high-resolution profiling of surface topography. An examination of local mechanical properties implies a definite tip-sample force interaction leading to elastic, viscoelastic or plastic deformation that the measured force-deformation relationship can be further employed for the extraction of quantitative mechanical properties. The major contributors to the tip-sample forces in AFM modes are the particular probe response, the set-point interaction level employed for feedback, stiffness of the probe, and the tip dimensions. The cantilever deflection, which is proportional to the overall tip force (a superposition of the attractive and repulsive components), is the feedback interaction in contact and HD modes.
Therefore, the choice of the set-point deflection is crucial for defining the varying-force imaging conditions. The probes, which we routinely apply for HD mode imaging, have a stiffness range of 0.4-40 N/m. Set-points deflections well below 1 nm were used in ambient conditions measurements, therefore, the tip-sample forces in this mode are close to tens of pN.The estimation of the tip-sample forces in AM mode, in which the damping of the probe amplitude at the primary eigen frequency is used for the feedback, demands a thorough theoretical consideration.
General hints related to the tip-force and sample deformation at different amplitude of free oscillation A0 and set-point amplitude - Asp in AM mode can be obtained from a simplified simulation of the tip-sample interactions using the Hertz model [13, 14].
In such conservative cases the relation between the amplitudes A0, Asp of the probe and its phase is shown below in equation (1).
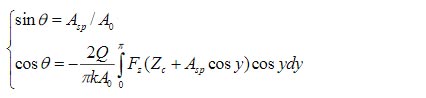 (1)
(1)
where A0 – the free probe amplitude, Asp – the set-point amplitude; Zc – a central position of the tip sphere over a surface during oscillations, k and Q – spring constant and quality factor of the probe at 1st flexural resonance, Fz – the tip-sample force (Hertz model) experienced by a probe in the approach and retract to the surface parts of the oscillatory cycles. A combination of these two equations gives the following expression (2).
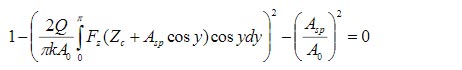 (2)
(2)
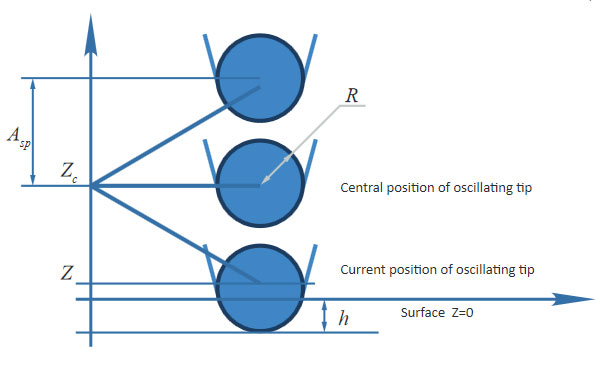
This formula allows finding Zc for given Asp. A sketch of the tip-sample contact with the tip having radius R (Figure 6) shows that the position of the center of the sphere Z = Zc - Asp and assuming that Z < R the maximal sample deformation - maxh=R-Z=R+Asp - Zc.
The maximal tip-force realized in intermittent contact can be calculated from the Hertz formula using deformation h = maxh.
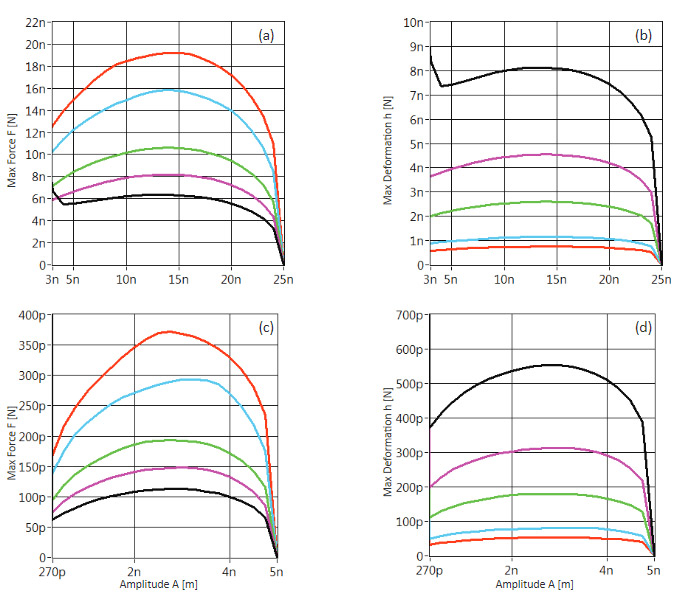
Using this approach we have performed computer simulations of the maximal tip force and sample deformation for probes of three types commonly applied in AM and HD modes [15](CGS 30 – stiffness ~0.5 N/n, NSG01 – stiffness ~2 N/m and NSG30 – stiffness ~40 N/m) on five model samples with different elastic modulus (65 MPa, 200 MPa, 600 MPa, 3 GPa and 7 GPa).
The graphs showing the dependence of the maximal force and maximal deformation on these samples for the experiments with the probes having stiffness of 40 N/m and 0.5 N/m applied with of 25 nm and 5 nm, respectively, are shown in Figures 7a-d. The tip radius was assumed to be 10 nm that is common for the commercial AFM probes. Several conclusions can be drawn from the analysis of these graphs. First, the maximal force and deformation are observed for amplitudes near half of A0. This result is consistent with the experimental measurements earlier made on a blend of PE components with different density [12].
Second, the maximal force and maximal deformation show an inverse dependence on elastic modulus of the sample. Third, the range of forces experienced by a sample in AM mode generally varies in the 100 pN – 20 nN range. Therefore, the AM and HD modes can operate at low forces over a comparable range.
However, the deformation of different samples with these modes is taking place at different time scales, which becomes very important in examining viscoelastic materials, such as many polymers. Therefore the combined analysis by HD and AM modes might be a better approach in understanding the structures of many samples as seen from the following example.
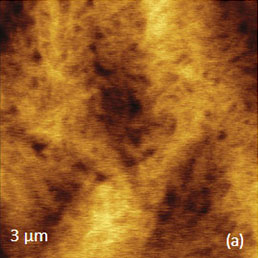
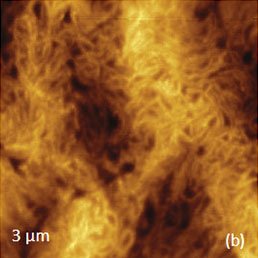
Our initial HD mode studies of SBS films on Si, which were obtained by spin-casting of the block copolymer solution in toluene at room temperature, showed that the surface of this sample can be easily depressed and even modified when the probes with stiffness of 4N/m and 40 N/m are applied [14]. The same sample can be examined with similar probes in the AM mode without material damage, and the force increase leads to a reversible probe deformation of the top later enriched in low surface energy polybutadiene rubbery blocks [16]. The same result was reproduced in HD mode when the soft probe with a stiffness of 0.5 N/m was applied.
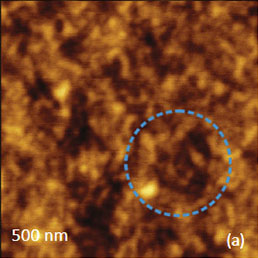
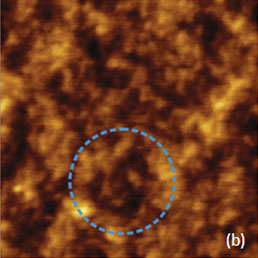
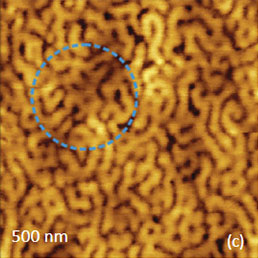
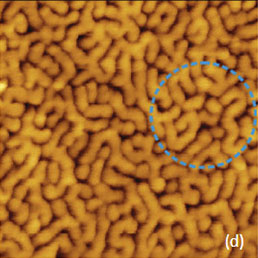
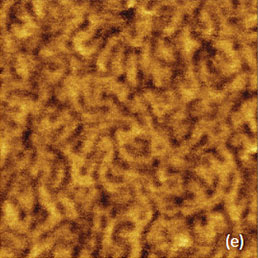
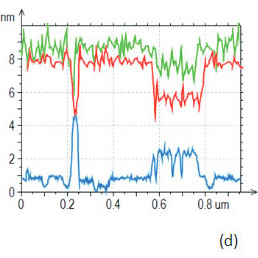
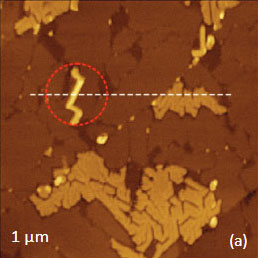
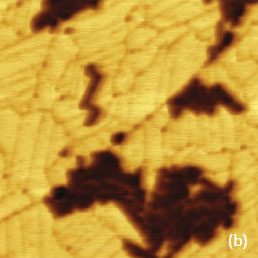
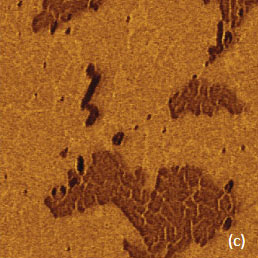
Images at the same location of the SBS film were obtained in both the AM and HD modes with this probe and they show practically identical surface features, Figures 8a-b. The observed disordered morphology is quite different from the ordered microphase-separated pattern common to the sub-surface organization in this film. When an SBS film was prepared by hot spin-casting, the micro phase-separation had proceeded more efficiently and the characteristic pattern was observed in the height image obtained in AM mode with the probe having a stiffness of 0.5N/m. The related phase image (not shown here) was featureless, which verifies low force imaging conditions.
The same location in the height image obtained at low force in HD mode appears with reversed contrast, as can easily be judged by the identical features in the locations marked with a blue circle. Remarkably, the micro-phase separation contrast was observed in the adhesion image but not in the stiffness image. Therefore the adhesion variations might also explain the reverse contrast of the height image in HD mode as compared to AM mode.
The exemplified problem is that the same level of the cantilever deflection during lateral scanning does not mean that the tip equally deforms the surface locations, which are dissimilar in adhesion. Therefore there is still room for improving HD imaging and for further consideration of operation at low, as well as, at high tip-sample forces.
ADVANCED VISUALIZATION OF SURFACE STRUCTURES WITH HYBRID MODE
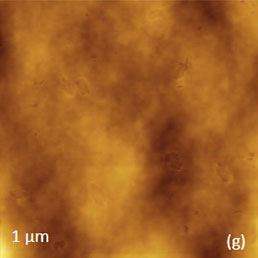
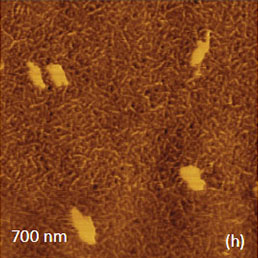
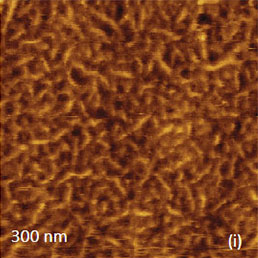
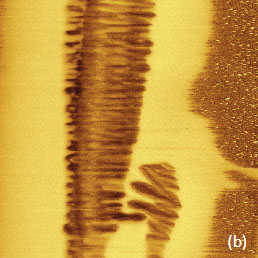
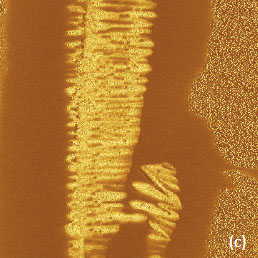
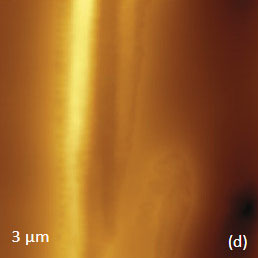
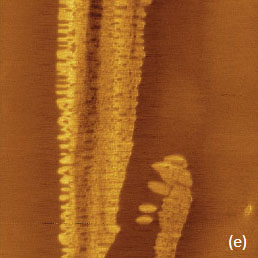
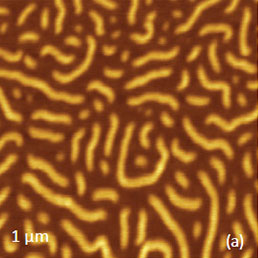
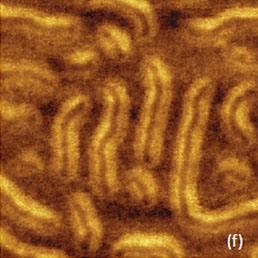
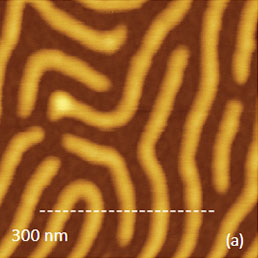
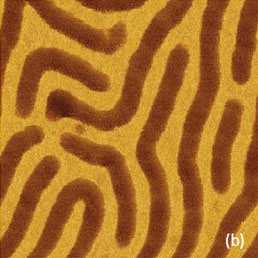
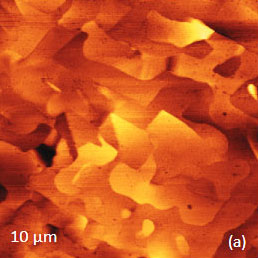
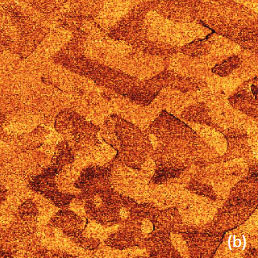
Visualization of surface structures is one of the primary goals of AFM and in studies of soft heterogeneous materials high-contrast images can be recorded in AM operation at elevated forces. This approach has been proven by studies of lamellar order in semicrystalline polymers, in which the amorphous component is in the rubbery state at ambient conditions. With the force increase, the AFM probe more strongly depresses the amorphous inter-lamellar regions and individual lamellae become visible in the images. Remarkably, the height images recorded on several polyethylene (PE) samples in HD mode exhibit lamellar organization with much better contrast than the AM images recorded at elevated forces. This is evident in Figures 9a-c that present the height images of linear low density polyethylene (LLDPE) obtained in these modes. The individual lamellae, most of which are seen in the edge-on orientation with thickness in the 10-20 nm range, are best resolved in the HD image. Their high contrast, most likely, reflects the fact that in HD mode tip indents the amorphous regions stronger than in the AM mode.
This deformation was reversible because the AM examination of the surface areas previously scanned in HD mode did not show any surface damage. The linear character of the polymer chains in LLDPE facilitates chain folding and related formation of extended lamellae, which are common for this material with density in the 0.91-0.93 g/cm3 range and elastic modulus in the 400-700 MPa range. The development of lamellar networks with shorter components is observed in PE whose molecules are characterized by extensive octene branching of the linear chains. Such materials are characterized by their lower densities (0.88-0.86 g/cm3) and more elastic mechanical behavior with elastic modulus below 70 MPa.
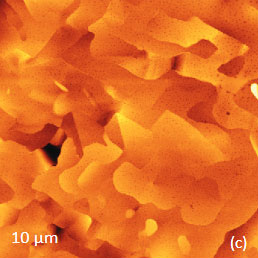
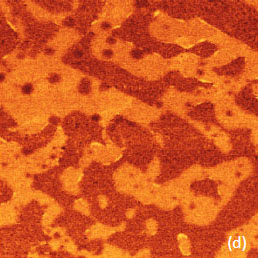
The morphology of the films, which were prepared by hot pressing from PE samples with density of 0.86 g/cm3 (PE/0.86) and 0.87 g/cm3, has been examined in AM and HD modes, Figures 9d-h. Similar to the case of LLDPE the lamellar order in these PE is best resolved in HD images. As expected, the individual lamellae in the PE/0.86 are shorter and their content is lower.
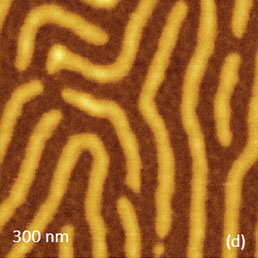
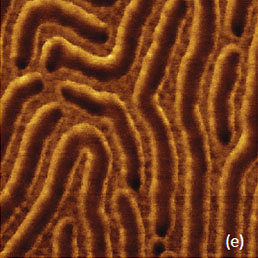
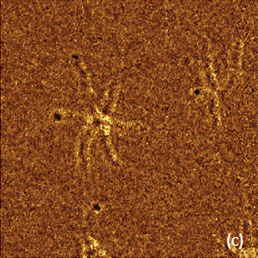
The high-contrast HD images are well suited for quantitative estimates of the crystallinity of the examined PE samples by evaluating the area occupied by lamellar structures. The study of lamellar order in PE samples is not an exclusive example of superior visualization of surface structures in HD mode. Similar experiences were accumulated in observations of chain order in single brush-like macromolecules based on poly(n-butyl acrylate), Figures 10a-f. The objects have been extensively examined with AFM because of spontaneous scission of covalent bonds upon their absorption on a substrate; see [17] and references in it.
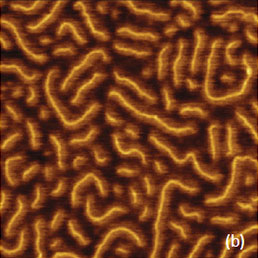
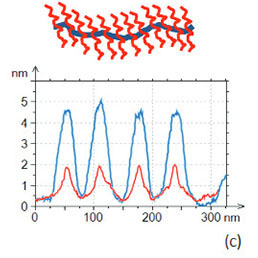
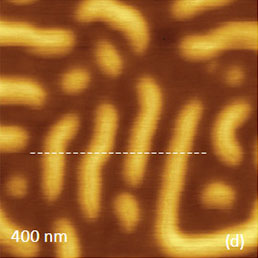
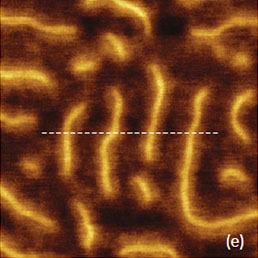
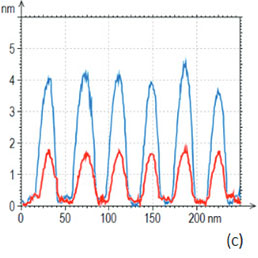
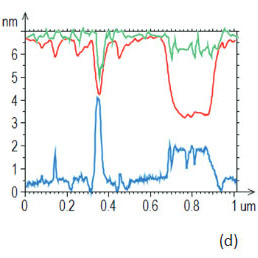
In our studies we examined several brush-like macromolecules, which were deposited on mica substrates using the Langmuir- Blodgett (LB) technique. The linear chain brushes with large side chains are seen in the AM images as extended stripes of 30 nm in width and 5 nm in height. The images of the same objects in HD mode reveal more structural details. They show the core of the macromolecules that are ~6 nm in width and darker border regions on both sides of the core that can be assigned to the side chains. The identical sample regions with a few macromolecules are emphasized in Figures 10d-e.
The cross-section profiles taken across the macromolecules demonstrate that in the HD image the macromolecules are seen as depressed entities 2 nm in height. This hints on a substantial deformation of the macromolecules by AFM tip in the HD mode, which actually helps distinguishing the structure of these brush macromolecules. The adhesion image in Figure 10f also reveals the macromolecular structure with the side chains and core having a different contrast. The analysis of the adhesive variations at such nanometer scale, where the objects and tip apex are of a comparable size, demands a separate consideration. The visualization of branched macromolecules with short side chains becomes challenging as we learned from the examination of such macromolecules with linear and star-shaped geometry. The images in Figures 11a-e show the same area of the LB film with an array of the linear chain macromolecules examined in AM and HD modes. In both modes, the height images (Figures 11a and 11d) show extended structures whose height differences (Figure 11c) reflect a substantial depression of the macromolecules in the HD mode. The contrast of the phase image in Figure 11b differentiates the macromolecules from the underlying substrate, whereas the adhesion image in Figure 11e shows more features. The brighter edges of the darker extended structures representing the individual macromolecules can be assigned to the short side chains. In contrast to the macromolecules with long side chains, the short chains are not distinguished in the height image recorded in the HD mode.
The adhesion image and stiffness images can be more informative in discerning the molecular core from side chain brushes as seen in the other example in brush-like macromolecules. Figures 12a-c. These images were recorded on star-shaped macromolecules with the brush-like beams.
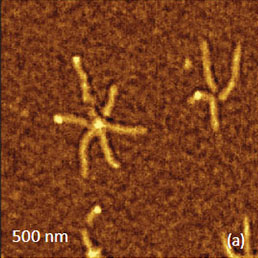
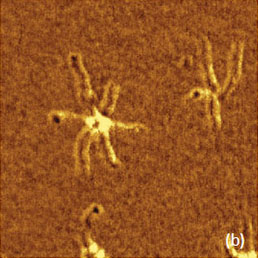
A comparison of the height contrast with that of the adhesion and stiffness maps reveals the exceptional sensitivity of the latter to the molecular structure details.The experimental results, which are presented in this part, clearly demonstrate that HD mode substantially improves the visualization of structural details in lamellar arrangements and brush-like macromolecules.
MAPPING LOCAL MECHANICAL PROPERTIES IN BINARY POLYMER BLENDS
A definite advantage of HD mode compared to the other AFM modes is the real-time mapping of the local adhesion and stiffness of samples. This capability is especially helpful used for heterogeneous materials where, besides compositional imaging, quantitative measurements of the properties can be performed not only for the individual components but also at the interfaces which might play crucial role in various materials performance. In the following, we will verify the mapping of adhesion and stiffness of binary blends of several polymers, which are listed in Table 1. The elastic moduli of the polymers, which were obtained by macroscopic mechanical studies, are also listed. The polymers exhibit a broad range of elastic moduli from 16 MPa to 7 GPa and, in addition, we have also examined a binary alloy of metals: Bi and Sn with elastic modulus of 32 GPa and 50 GPa, respectively. The polymers presented in Table 1 have amorphous and semi-crystalline nature.
Table 1. Polymers used in binary blends and their elastic moduli
| Polymer (name and abbreviation) | Elastic modulus |
|---|---|
| Polybutadiene, PBD | 16 MPa |
| Polyethylene with octene branches, PE/0.86 | 16 MPa |
| Polyethylene with octene branches, PE/0.87 | 65 MPa |
| Low-density polyethylene, LDPE | 152-290 MPa |
| Linear low-density polyethylene, LLDPE | 140 MPa -1.5 GPa |
| Poly(methyl methacrylate), PMMA | 2.4 GPa |
| Poly(vinyledene fluoride), PVDF | 2.4 GPa |
| Atactic polystyrene, PS | 3.0-3.5 GPa |
| Syndiotactic polystyrene, sPS | 7.0 GPa |
For the case of semicrystalline materials the macroscopic elastic response represents an overall modulus of the lamellar and amorphous entities and the broad modulus variations reflect the different morphology and crystalline content of such materials.
As we have seen from the images of PE samples in Figures 9a-i, the local variations of the mechanical properties are observed at the nanometer scale when the probe crosses individual lamellae and amorphous inter-lamellar regions. This specific feature of semicrystalline polymers should be considered while comparing the macroscopic and nanoscale mechanical responses.
The polymer samples for this study were prepared by mixing the components in their common solvents at high temperature and thin films of polymer blends were spin cast on Si substrates at elevated temperatures. This procedure helps mixing of mostly immiscible components, such that the microphase separation spans through the tens of nanometers to tens of microns scales.
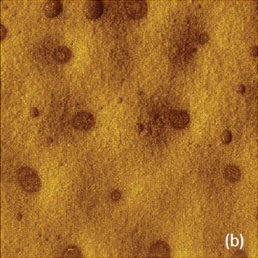
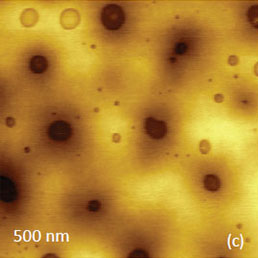
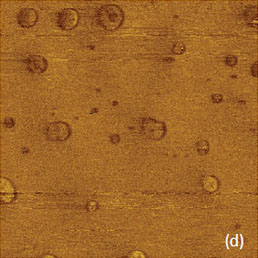
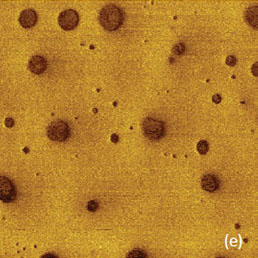
In the analysis of nanomechanical mapping in HD mode we will consider binary blends of atactic polystyrene (PS) with polybutadiene (PBD), low-density polyethylene (LDPE) and the blend of PBD and PE/0.86. The morphology of the PS-PBD blend, in which both components are amorphous polymers, is characterized by spherical and elliptical inclusions of one component into the matrix of other material, Figures 13a-f. Some of the inclusions are of few nanometers in size.
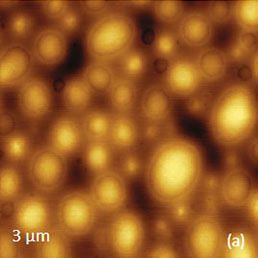
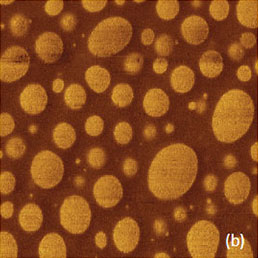
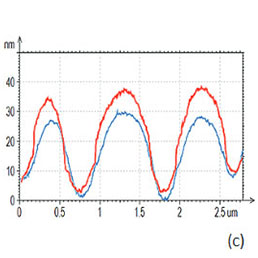
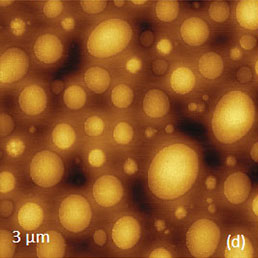
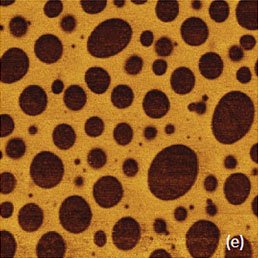
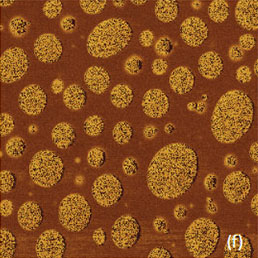
The height images of the same blend location, which were obtained in both AM and HD modes (Figures 13a-b), do look practically identical with the exception of few details. The cross-section profiles, which were taken across the same domains (Figures 13c), do show that the domains are more elevated in the HD height image.
This suggests a tip-induced depression of the surrounding matrix and its assignment to the softer PBD component. Such deformation also makes less visible the rims around the domains in the height image recorded in HD mode compared to AM mode. The phase image obtained in AM mode clear differentiates the components of this sample, yet leaves the question regarding the assignment of the contrast to the particular component and specific properties unanswered.
The latter is achieved in the adhesion and stiffness maps (Figures 13e-f) that make consistent the assignment of higher stiffness and lower adhesion of the inclusions to dominant presence of PS material. The analysis of the quantitative mechanical properties in AFM is largely based on the consideration of DvZ curves and characteristics of the probe. In principle, the existing capabilities of fast data acquisition and analysis of such curves makes possible the real-time display of the quantitative analysis.
The problem, however, is in the analysis of such curves as those recorded in HD mode study of the PS-PBD blend, Figure 14a-b. The DvZ plot obtained for PS and PBD locations at relatively small set-point deflection are quite different in the repulsive and attractive force parts.
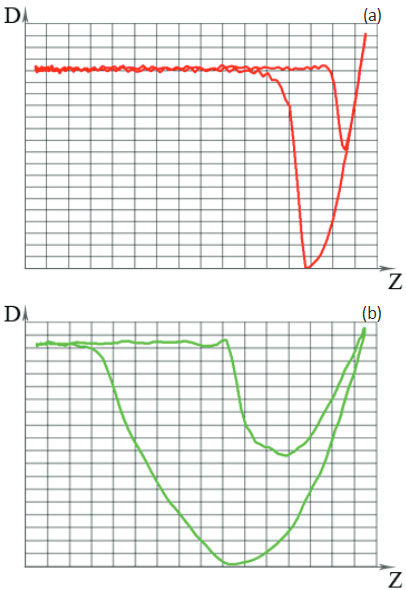
Figure 14. DvZ curves collected on PS and PBD locations, respectively
The loading and unloading slopes for PS are identical, and this suggests the reversible character of the tip-sample induced deformation. Such curves, which are even more common for rubbery polymers, can be treated in the framework of the elastic solid state deformation models (DMT, JKR, Sneddon) and the obtained modulus and work of adhesion values well correlate with macroscopic data as we have shown in one of the previous application notes [18].
The deformation of the PBD location is quite different, and the difference of the loading and unloading slopes point out the energy dissipation in this process. This result can be expected because PS and PBD differ not only in the elastic modulus but also in viscoelasticity.
The measure of viscoelasticity of polymer materials is tanδ – the ratio of the dissipative and conservative components of the complex modulus, and this parameter shows much higher viscoelasticity of PBD (tanδ = 0.6) as compared to PS (tanδ = 0.02). Unfortunately, up to now there are no reliable viscoelastic models that can be applied for the analysis of AFM data. Therefore, a highly desirable conversion of the adhesive and stiffness contrast to the quantitative mechanical characteristics remains a challenging problem for many materials.
To broaden the adhesion and stiffness mapping to other blends we will consider the results obtained on the PS-LDPE and PBD-PE/0.86 blends. Both blends are incompatible mixture of amorphous and semicrystalline polymers that facilitate the image analysis, because the lamellar structures of one of the components can be visualized. The circular inclusions in the matrix were observed in HD images of the PS-LDPE blend, Figures 15a-c.
The lamellar structure inside the inclusions indicates that they are enriched in LDPE and the lower stiffness of these domains is consistent with relative softness of this component. We have also verified that imaging at an elevated tip-sample force the inclusions are more depressed compared to the matrix that primarily consists of PS.
The interest in the HD imaging of the PBD-PE/0.86 blend is related to the fact that these components are characterized by quite similar macroscopic elastic modulus of ~16 MPa yet they have quite different viscoelastic responses: tanδ = 0.25 for PE/0.86 is much smaller than that for PBD. The AM and HD images of this blend are shown in Figures 16a-e. Again the height images in both modes are quite similar but phase, adhesion and stiffness images clearly distinguish the locations of different components.
The stiffness image with higher magnification (not shown here) showed a presence of lamellar structures inside the darker circular domains and this observation allows their assignment to the semicrystalline PE/0.86. This example clearly emphasizes an urgent need of better understanding how differences in viscoelasticity of polymers are reflected in the adhesion, stiffness and phase images. Such understanding will make the local nanomechanical analysis truly quantitative if the adaptive on-line force curve analysis will assist in choosing the correct model for extraction of the mechanical properties.
COMBINING LOCAL MECHANICAL AND ELECTRIC STUDIES
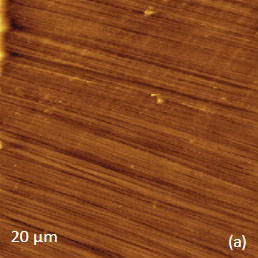
The examination of local mechanical properties is not limited to polymer materials whose elastic modulus is typically below 10 GPa. Stiff probes with spring constants of 200 N/m and higher can be applied for HD studies of metal samples such as an incomplete alloy of Bi and Sn. The height and stiffness images of the alloy samples, which were prepared by hot melting between two mica sheets, are shown in Figures 17a‑b.
The sample topography is relatively flat and it exhibits multiple contours of crystalline domains. The stiffness map emphasizes the domains with different contrast and the brighter domains are likely related to Sn whose elastic modulus (50 GPa) is substantially higher than that of Bi (32 GPa). This observation can be complemented by Kelvin probe force microscopy (KPFM) studies that are capable of distinguishing metals due to differences of their work functions. Therefore the surface area shown in Figures 17a‑b was also examined with single-pass KPFM experiment using a conducting probe with regular stiffness of 2 N/m, Figures 17c-d. Surface potential contrast of the domains has two levels in line with the stiffness map. This serves as an additional confirmation of the domains’ assignment to the two different metals. This suggestion is also in agreement with the fact that the difference between the surface potential of the domains is close to the difference of work functions of Bi (4.22 V) and Sn (4.42 V).
The presented surface potential image of Bi and Sn alloy was accomplished in the single-pass mode with phase modulation (PM) used for recording and nullifying the electrostatic tip-sample force.
This is the preferred mode choice for the most accurate and high-resolution KFM studies as confirmed by the images shown in Figures 18a-d. A comparison of the surface potential images of the same location of the Bi/Sn alloy shows that the surface potential changes between two metals are most pronounced and most spatially resolved in the single-pass PM-KPFM image.
The surface potential steps recorded in the images obtained in the two-pass procedure and in the single-pass mode with AM detection of the electrostatic force are smaller and further away from the actual difference between the work functions of these metals.
One of the related issues is that a recording of the tip-sample electrostatic forces in the lift mode proceeds with the probe being distant from the surface.
The same is true for recording the baseline variations in HD mode that makes this approach inferior to the single-pass mode where the tip is in the immediate vicinity of the sample.
A combination of the structural information with local mechanical and electric properties is the essence of comprehensive AFM analysis of the materials, which is illustrated in Figures 19-20. Here we present the images of the same location on self-assemblies of semi-fluorinated alkanes [CF3(CF2)14(CH3)20CH3] on graphite.
These images were collected in HD mode with recording adhesion and stiffness maps (Figures 19a-d) and in AM mode with acquiring surface potential and capacitance gradient information (Figures 20a-d).
The topography of the sample is formed by flat lamellar sheets of the fluoroalkanes laying on the substrate and by islands of self-assemblies made of 4-nm thick extended blocks and spirals.
The molecules are lying flat in the lamellae and adopt a preferentially vertical orientation in the self-assemblies with the fluorinated segments facing away from the surface [19]. These topographic and molecular organization features define the mechanical and electric properties of the structures. The lamellar sheets lying directly on the hard substrate are effectively stiffer than the elevated self-assemblies, Figure 19c. The top surface of most assemblies is enriched in fluorinated groups whereas the surface of flat-lying lamellar has an equivalent presence of the fluorinated and hydrogenated entities. These chemical variations are reflected in the adhesion map, where the self-assemblies exhibit lower stickiness, Figure 19b.
The height, adhesion and stiffness profiles along one of the direction are shown in Figure 19d. The surface potential and dC/dZ of the same sample location are presented in Figures 20b-c. The molecular orientation is the prime reason for the surface potential contrast, which is negative (~-0.8 V) at self-assemblies due to the vertical orientation of the molecular dipoles of the central –CH2-CF2 - junctions and the end groups – CF3 [18]. The variations of the dC/dZ contrast
are
more complicated because they reflect not only the dielectric property of the material but also its thickness.
Therefore, the contrast of the same features in the topography, surface potential and dC/dZ images might be quite different as is the case for
the extended elevated block emphasized by the red circle. This block has a darker contrast than the other self-assemblies in the dC/dZ map because it is higher than the others. The local differences between the height, surface potential and dC/dZ profiles are emphasized in Figure 20d. Above we have discussed the extraction of quantitative nanomechanical (QNM) data from the adhesion and stiffness map; in addition the quantitative electric measurements (QEM) are also of high importance. In the case of surface potential, which is determined directly, the main issue is the reproducibility of these studies in ambient conditions where the quantitative surface potential differences in a single scan are more reliable than the absolute values. The extraction of the quantitative values of local dielectric permittivity demands the computational efforts and knowledge of the sample thickness. First efforts in this direction were undertaken and the local dielectric permittivity was determined for ultrathin films of PS and poly(vinyl acetate) on conducting glass [20].
CONCLUSIONS
This application note has introduced the HD mode whose capabilities were illustrated by multiple examples and by the comparison with AM mode. The following conclusions can be drawn from this analysis. The HD mode can be successfully applied to the broad range of samples and the tip-sample force interactions are varied in a similar range as compared to the AM mode. Yet there are specific, and some not necessarily well understood features, of the tip-sample interactions that make HD mode a very useful addition to the family of AFM techniques.
We have demonstrated that, for a number of samples, this mode uniquely provides superior image contrast that enhances AFM visualization of nanoscale and molecular structures.
This mode is also superior in measurements of local mechanical properties starting from high-resolution mapping of adhesion and stiffness variations to potentially adaptive nanomechanical analysis of the elastic and viscoelastic behavior of polymer materials. Finally, the use of HD mode with enhanced capabilities in studies of nanomechanical properties in concert with single-pass and multi-frequency AM mode measurements of electric properties enhanced with QEM provides the most advanced platform for comprehensive AFM analysis.
ACKNOWLEDGMENTS
Prof. M. Moeller (DWI, Aachen, Germany), Prof. S. Sheiko (UNC, Chapel Hill, NC), and Prof. Kuljanishvili (SLU, Saint Louis, MO), Prof. V. Papkov (INEOS, Moscow) are cordially thanked for providing the examined samples of semifluorinated alkanes, brush-like macromolecules, carbon nanotubes and PDES polymer. Dr. S. Leesment is acknowledged for the data obtained on Bi/Sn alloy. My colleagues at NT-MDT Development Inc.: Dr. S. Belikov, Dr. C. Wall and J. Alexander are thankful for the everyday support and for their help with the preparing the data and writing for this application note.
REFERENCES
1. Y. Martin, C. C. Williams, and H. K. Wickramasinghe “Atomic force microscope-force mapping and profiling on a sub 100-Å scale” J. Appl. Phys. 1987, 61, 4723–4729.
2. Q. Zhong, D. Innis, K. Kjoller, and V. Elings “Fractured polymer/silica fiber surface studied by tapping mode atomic force microscopy” Surf. Sci. Lett. 1993, 290, L688–L692.
3. H. Becker, O. Bender, B. H. vor der Hone, L. Bergmann, K. Rost and A. Zobel “Stylus profiler featuring an oscillating probe” US Patent 2728222, issued Dec. 27, 1955.
4. V. B. Elings, and J. A. Gurley “Jumping probe microscope” US Patent 5,229,606, 1993 (filled 1989).
5. S. Magonov “NEXT Visualization of Surface Structures” Application Note 086, NT-MDT Spectrum Instruments. It can be downloaded from https://www.ntmdt-si.com/resources/applications
6. S. Magonov “AFM-based Electrostatic Modes” Application Note 084, NT-MDT Spectrum Instruments.
It can be downloaded from https://www.ntmdt-si.com/resources/applications
7. S. Magonov “Piezoresponse Force Microscopy in Its Applications” Application Note 083, NT-MDT Spectrum Instruments. It can be downloaded from https://www.ntmdt-si.com/resources/applications
8. A. L. Weisenhorn, P. K. Hansma, T. R. Albrecht, and C. F. Quate “Forces in atomic force microscopy in air and water” Appl. Phys. Lett. 1989, 54, 2651-2653.
9. N. A. Burnham, and R. J. Colton “Measuring the nanomechanical properties and surface forces of materials using an atomic force microscope” J. Vac. Sci. Technol. A 1989, 7, 29 06–2913.
10. S. N. Magonov, V. Elings, and V. S. Papkov “AFM Study of Thermotropic Structural Transitions of Poly(diethylsiloxane)” Polymer 1997, 38, 297-307.
11. Yu. K. Godovsky, V. S. Papkov, and S. N. Magonov “Atomic force microscopy visualization of morphology changes resulting from the phase transitions in polydi-n-alkylsiloxanes: Polydiethylsiloxane” Macromolecules 2001, 34, 976-990.
12. S. N. Magonov “AFM in Analysis of Polymers” Encyclopedia of Analytical Chemistry, (R. A. Meyers, Ed.), pp. 7432-7491, John Willey & Sons Ltd, Chichester, 2000.
13. S. Belikov and S. Magonov “Classification of Dynamic Atomic Force Microscopy Control Modes Based on Asymptotic Nonlinear Mechanics” Proceedings American Control Society, St. Louis, 979-985, 2009.
14. S. Belikov, J. Alexander, C. Wall, and S. Magonov “Tip-Sample Forces in Atomic Force Microscopy: Interplay between Theory and Experiment” Fall 2012 MRS Meeting Proceedings, 2013, in press.
15. www.ntmdt-tips.com
16. S. N. Magonov, V. Elings, J. Cleveland, D. Denley, and M. H. Whangbo “Tapping-mode atomic force microscopy study of the near-surface composition of a styrene-butadiene-styrene triblock copolymer film” Surface Science 1997, 389, 201-211.
17. N. V. Lebedeva, A. Nese, F. C. Sun, K. Matyjaszewski, and S. S. Sheiko “Anti-Arrhenius cleavage of covalent bonds in bottlebrush macromolecules on substrate” PNAS 2012, 109, 9276-9280.
18. S. Magonov “Exploring Nanomechanical Properties of Materials with Atomic Force Microscopy” Application Note 085, NT-MDT Spectrum Instruments. It can be downloaded from https://www.ntmdt-si.com/resources/applications
19. J. Alexander, S. Magonov, and M. Moeller “Topography and surface potential in Kelvin force microscopy of perfluoroalkyl alkane self-assemblies” JVST B 2009 B27 (2), 903-911.
20. S. Belikov, J. Alexander, S. Magonov, and I. Yermolenko “Towards quantitative local dielectric analysis of polymers” Amer. Control Conference 2012, 3228-3233.